C0Omics Technologies
Understand metabolomics, proteomics, transcriptomics, exposomics and multi-omics analysis and how to apply them in real-world research
Omics technologies allow researchers to measure thousands of biological molecules simultaneously, providing a comprehensive view of how biological systems function. Fields such as metabolomics, proteomics, transcriptomics and exposomics capture different layers of biology. From gene regulation to protein activity, metabolism and environmental chemical exposures.
Together, these technologies help researchers characterize how biological systems respond to disease, drugs and environmental factors. This guide from Panome Bio provides an overview of the major omics disciplines, the technologies behind them and how they are used in modern biological research. It is designed to help you understand which omics approach fits your research needs and how different technologies can be applied in practice. Each section includes links to technical resources, datasets and case studies so you can explore topics in more depth when needed.
C1What are Omics Technologies?
Omics technologies are large-scale analytical approaches used to measure and analyze biological molecules in cells, tissues or organisms. These methods allow researchers to study thousands of molecules simultaneously, providing a systems-level view of biological processes (DOI: 10.1186/s13059-017-1215-1).
Major omics disciplines include:
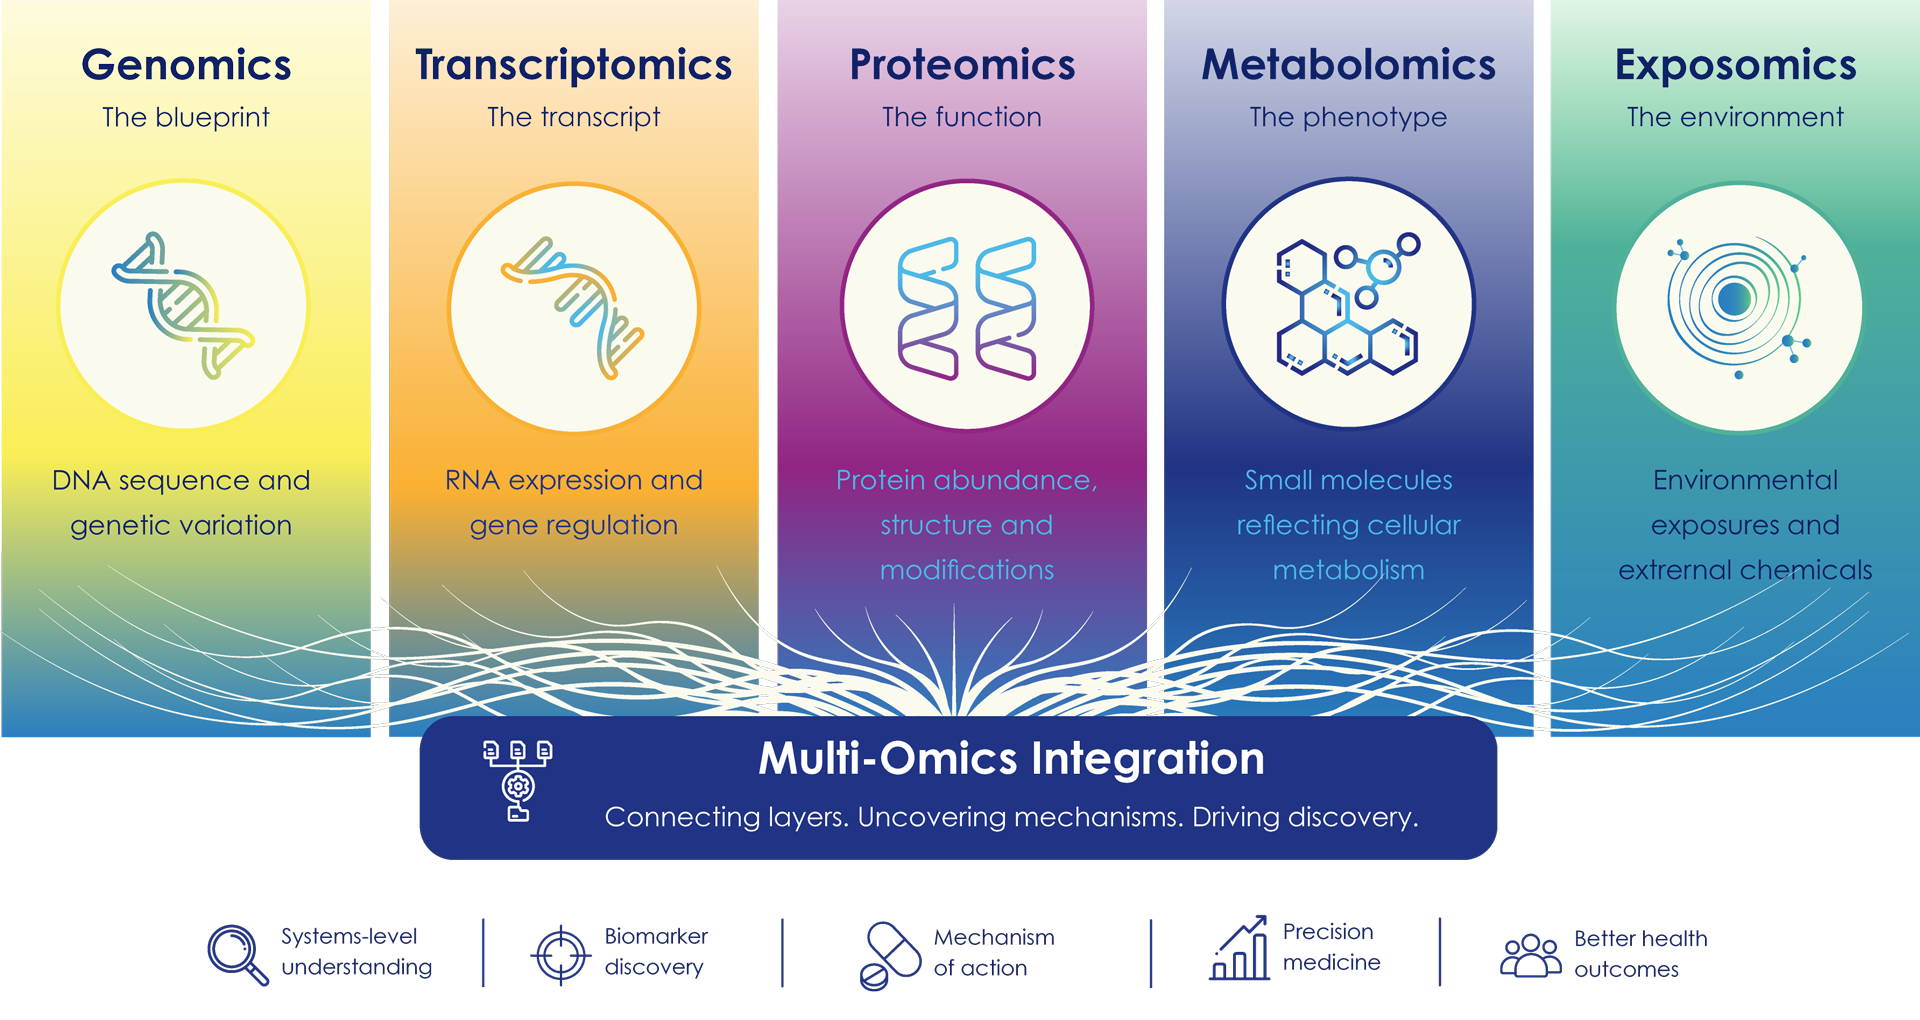
- Genomics: The study of DNA and genetic variation
- Transcriptomics: The study of RNA expression and gene regulation
- Proteomics: The study of proteins and their functional activity
- Metabolomics: The study of small molecules that reflect cellular metabolism
- Exposomics: The study of environmental exposures and external chemicals affecting biology
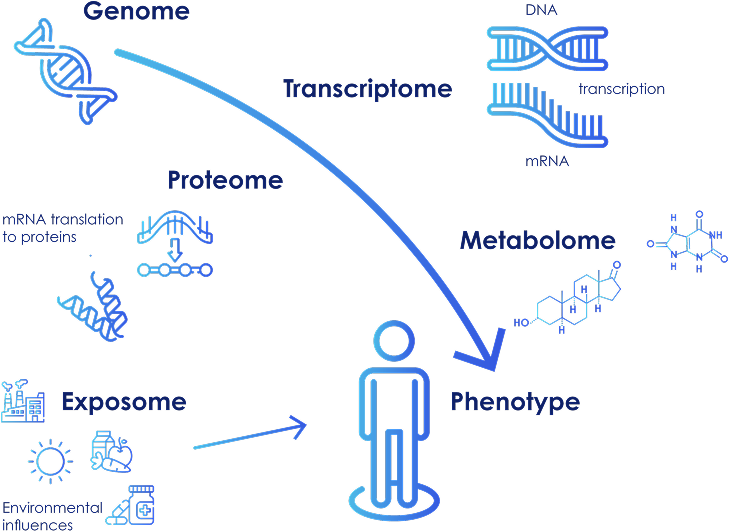
Figure 1: Overview of major omics fields. Genomics studies DNA, transcriptomics analyzes RNA expression, proteomics examines protein activity, metabolomics measures cellular metabolites and exposomics investigates environmental exposures affecting human biology.
Each layer provides different information about how biological systems function. When combined, these technologies enable researchers to connect genetic information, molecular activity and environmental influences on observable biological outcomes.
Across real-world studies, these layers are most powerful when interpreted together to understand biological systems as a connected network rather than in isolation.
Table 1: Comparison of Omics Technologies & Measurement Methods
| Omics Field | Measures | Key Molecules | Common Measurement Technologies |
|---|---|---|---|
| Genomics | Genetic blueprint | DNA | Next-Generation Sequencing (NGS), Whole-Genome Sequencing (WGS), Whole-Exome Sequencing (WES) |
| Transcriptomics | Gene expression | RNA | RNA Sequencing (RNA-seq), microarrays |
| Proteomics | Protein activity | Proteins | Liquid chromatography-mass spectrometry (LC-MS) |
| Metabolomics | Cellular metabolism | Metabolites | LC-MS, GC-MS, capillary electrophoresis-MS (CE-MS), NMR spectroscopy |
| Exposomics | Environmental chemical exposures | External chemicals | High-resolution LC-MS, GC-MS, non-targeted chemical screening |
Each omics field focuses on a different layer of biological information and uses specialized analytical technologies to measure molecular activity.
C2Metabolomics: Measuring the Functional State of Biology
Metabolomics is the large‑scale measurement of small molecules, called metabolites that serve as substrates and products for metabolic reactions. They can be produced endogenously or come from exogenous sources (food, drugs, environment). As the integrated output of gene expression, protein activity and environmental influences, metabolites provide a direct near-real-time readout of biological phenotype (DOI: 10.1038/nrm3314).
- Captures rapid physiological changes driven by environment or disease
- Measures pathway activity directly rather than biological potential
- Reflects combined genetic, epigenetic and environmental influences in a single dataset
For these reasons, metabolomics is widely used to measure biological processes, discover biomarkers, characterize mechanism‑of‑action studies, support disease stratification or characterize molecular changes across a wide range of biological systems.
Panome Bio’s Next‑Generation Metabolomics® platform combines broad molecular coverage with advanced computational analytics to enable large-scale untargeted metabolomics. Powered by MassID™, a cloud-based proprietary computational system designed to address the limitations of traditional workflows and support systematic, unbiased metabolite identification.
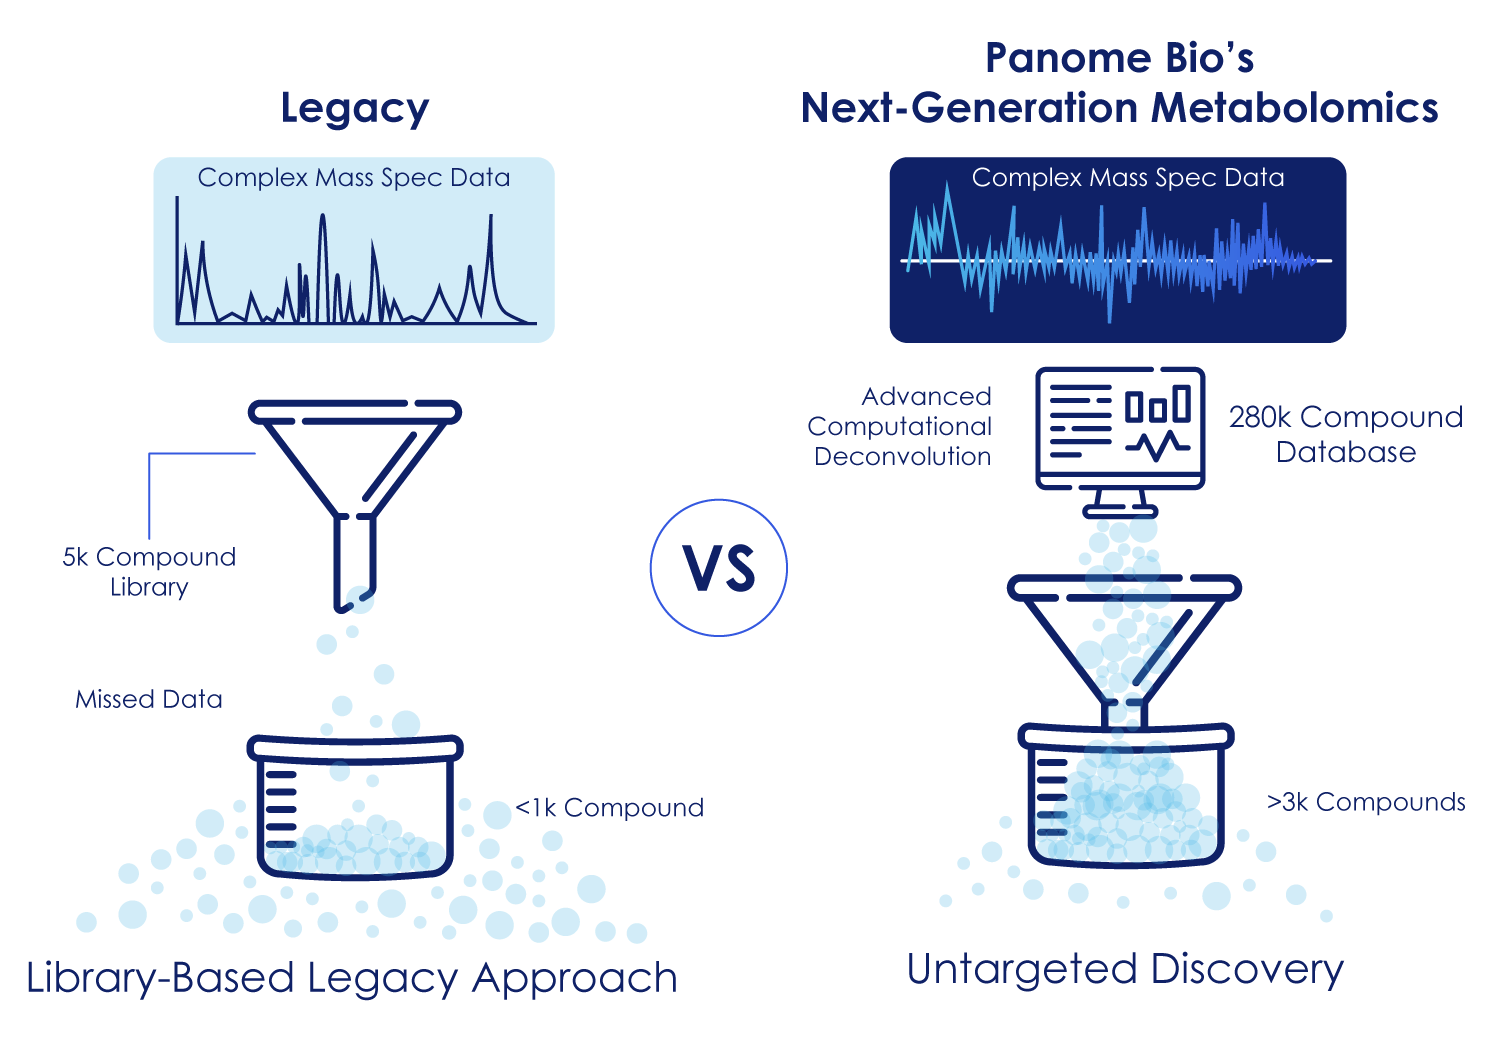
Figure 2: Next-Generation Metabolomics Not Limited to a Library. Rather than matching against a predefined metabolite library, MassID converts complex LC/MS data into scored metabolite identifications, with machine-learning-based computational workflow and a database of over 280,000 compounds.
C2-1Untargeted Metabolomics vs. Quantitative Targeted Metabolomics
A central decision in any metabolomics study is whether to use a targeted or untargeted metabolomics approach. While “untargeted metabolomics” is the standard term in the field, Panome Bio refers to its advanced untargeted workflows as Next-Generation Metabolomics, reflecting enhanced metabolite coverage, data quality and quantitative performance.
Table 2: Untargeted Next-Generation Metabolomics & Targeted Metabolomics comparison (DOI: 10.1021/acs.analchem.5b04491)
| Untargeted Metabolomics | Targeted Metabolomics |
|---|---|
| Measures thousands of molecules | Measures a predefined panel |
| Hypothesis-free discovery | Precise quantification |
| Exploratory, ideal for novel biology | Validation, pathway-focused |
C2-1-1Untargeted Next-Generation Metabolomics
- Captures a wide range of metabolites, including unexpected or novel compounds
- Provides pathway-level insight across multiple biological systems
- Supports hypothesis generation for new biomarkers or mechanisms
- Ideal for early-stage research, cohort studies or disease profiling
In a case study untargeted metabolomics analysis of FFPE tissues Next-Generation Metabolomics detected robust and reproducible metabolic differences between tumor and normal adjacent tissue. These differences were consistently observed and validated against matched fresh-frozen samples, confirming the biological relevance and reliability of the detected signals. Find out how you can make novel discoveries with untargeted metabolomics in cancer from FFPE samples.
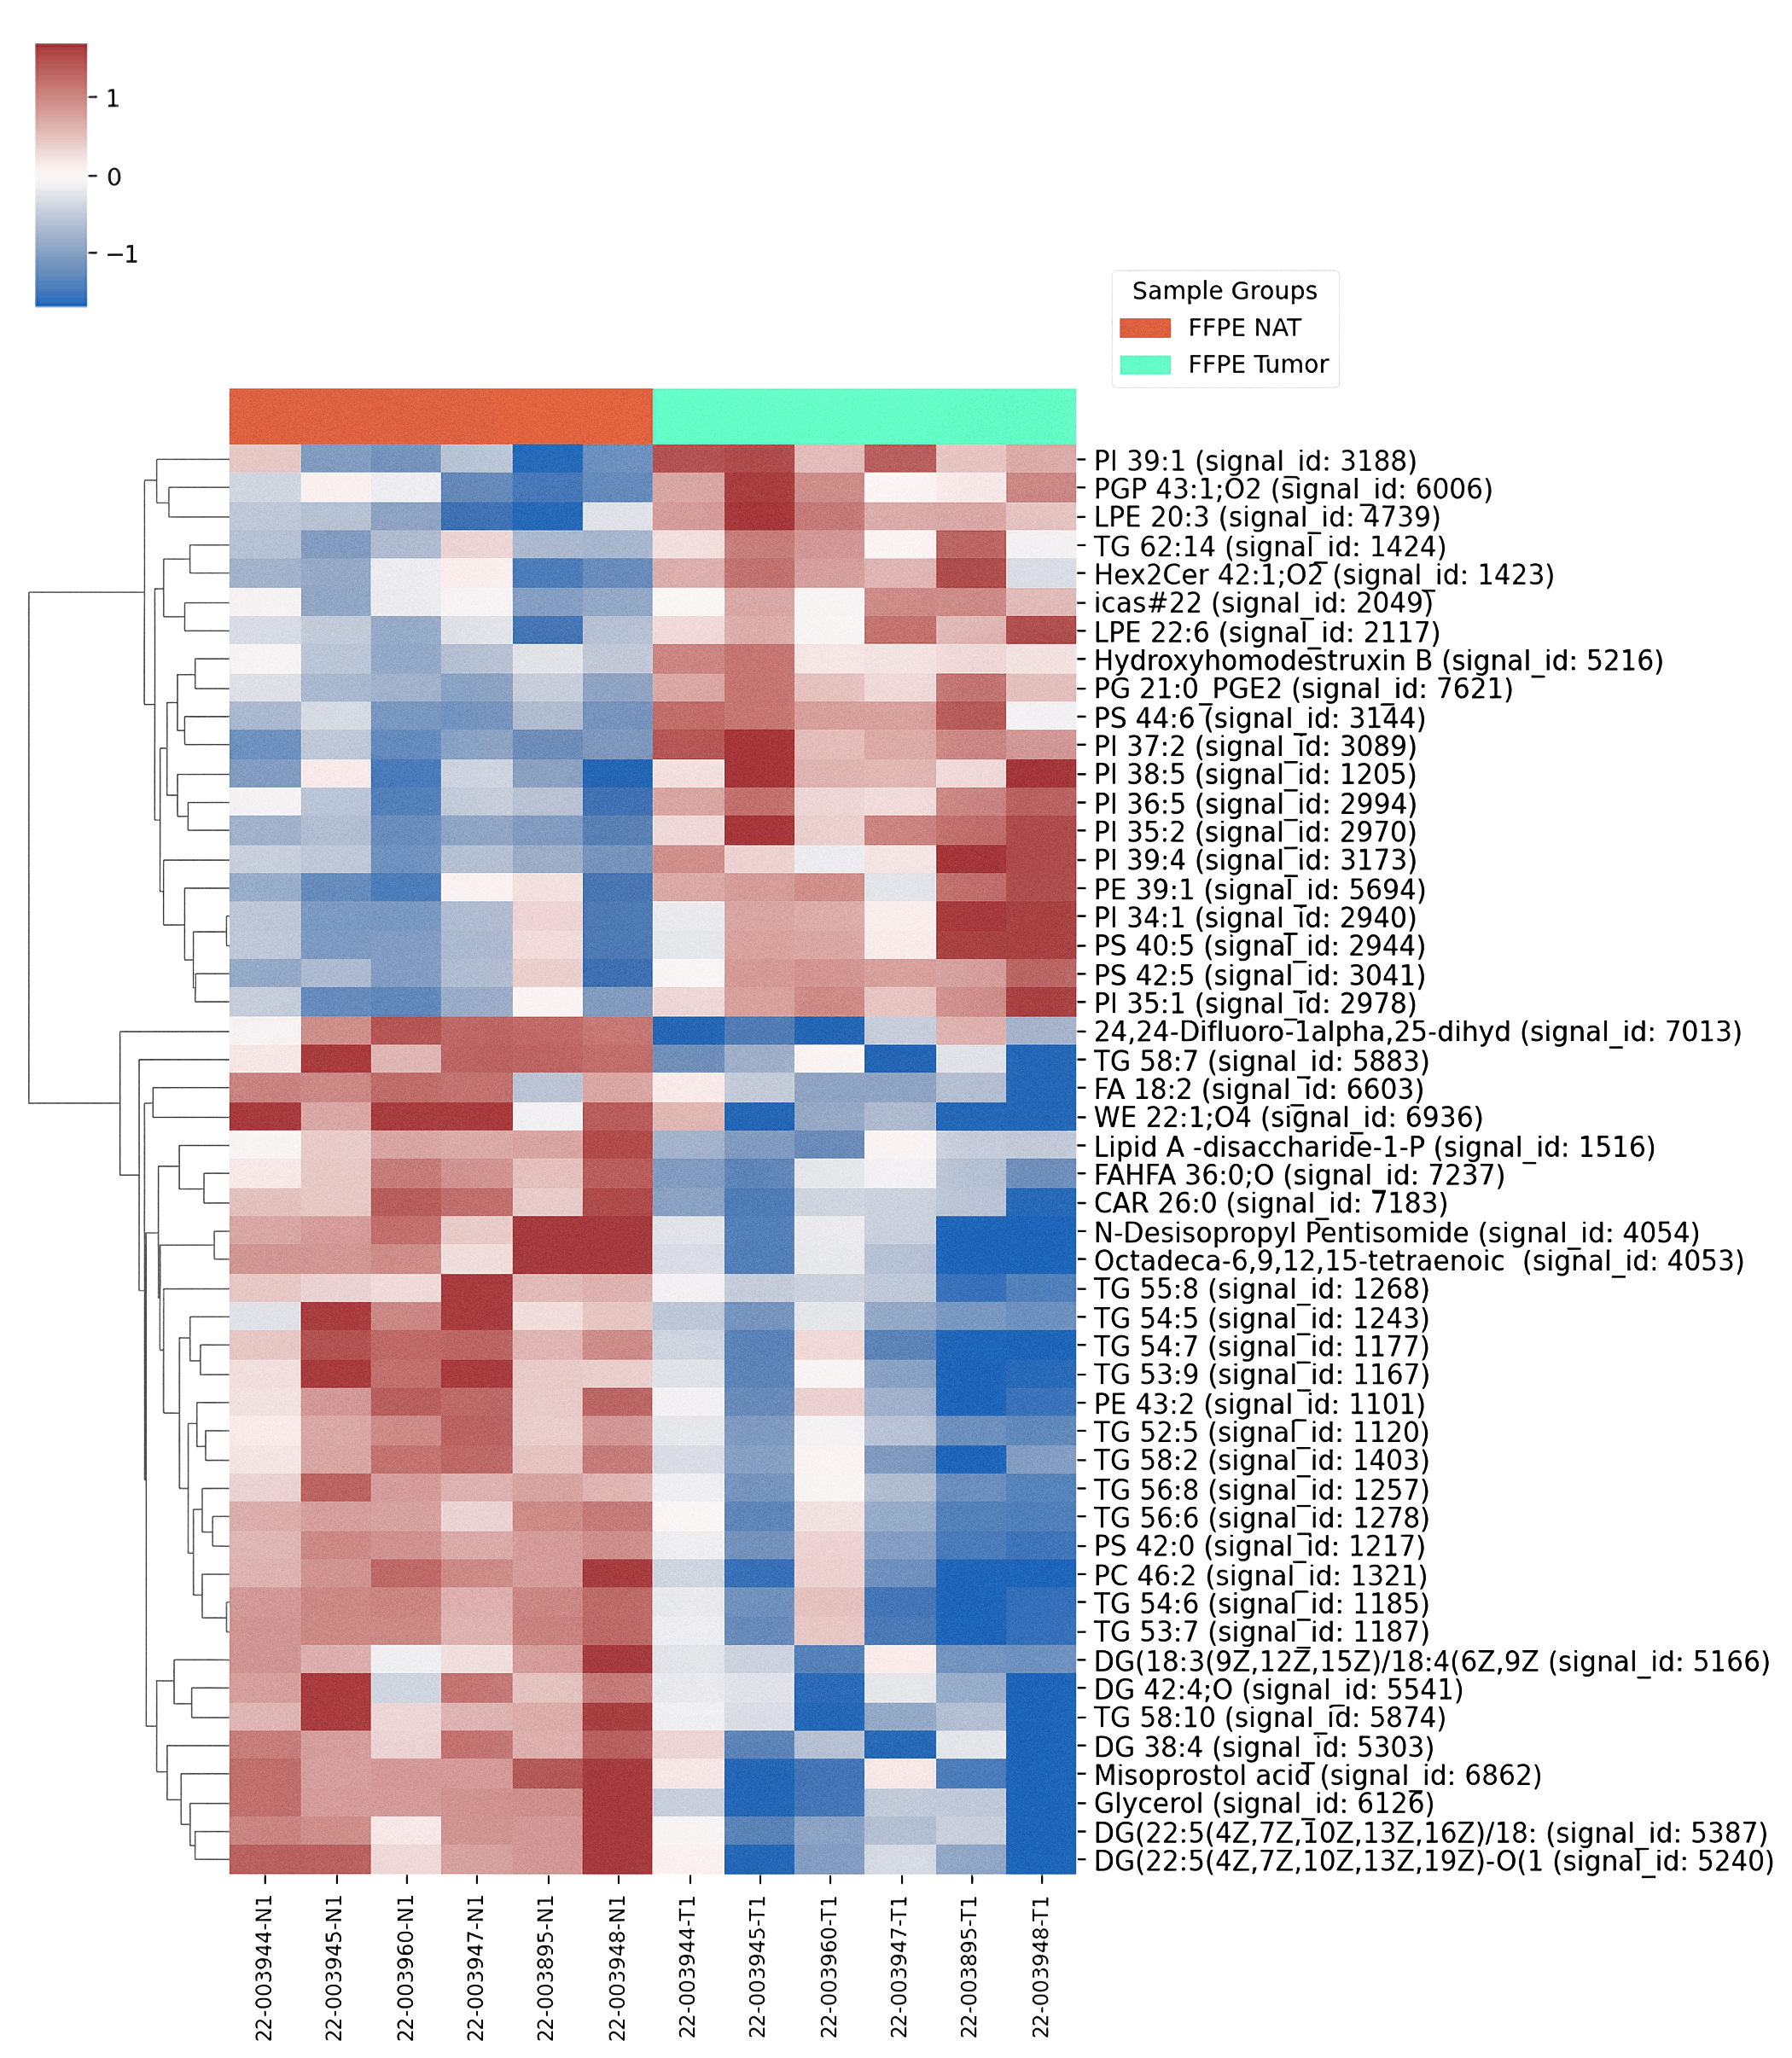
Figure 3: Heatmap of significantly altered metabolites. This heatmap illustrates cancer vs. adjacent normal FFPE tissues. Heatmaps are a two-dimensional visualization technique used to display complex data patterns. Color variation indicates relative abundance and expression intensity (here: red for upregulated and blue for downregulated metabolites). This representation provides a comprehensive, untargeted view of global metabolite changes.
C2-1-2Targeted Metabolomics
- Quantifies predefined metabolites with high sensitivity and reproducibility
- Supports clinical or regulatory validation studies
- Ideal for tracking disease progression, drug response or pathway-specific questions
- Provides robust, comparable data across samples and experiments
See how quantitative, targeted metabolomics was used in colorectal cancer study. Beyond individual metabolite levels, targeted metabolomics enables calculation of metabolite ratios and pathway-informed composite metrics, known as MetaboIndicators. These include reaction-level ratios and lipid class summaries that provide functional insight into metabolic activity. In this study, over 200 MetaboIndicators were assessed, with TMAO synthesis (direct), MA (NBS), and cystine synthesis showing statistically significant differences between groups.
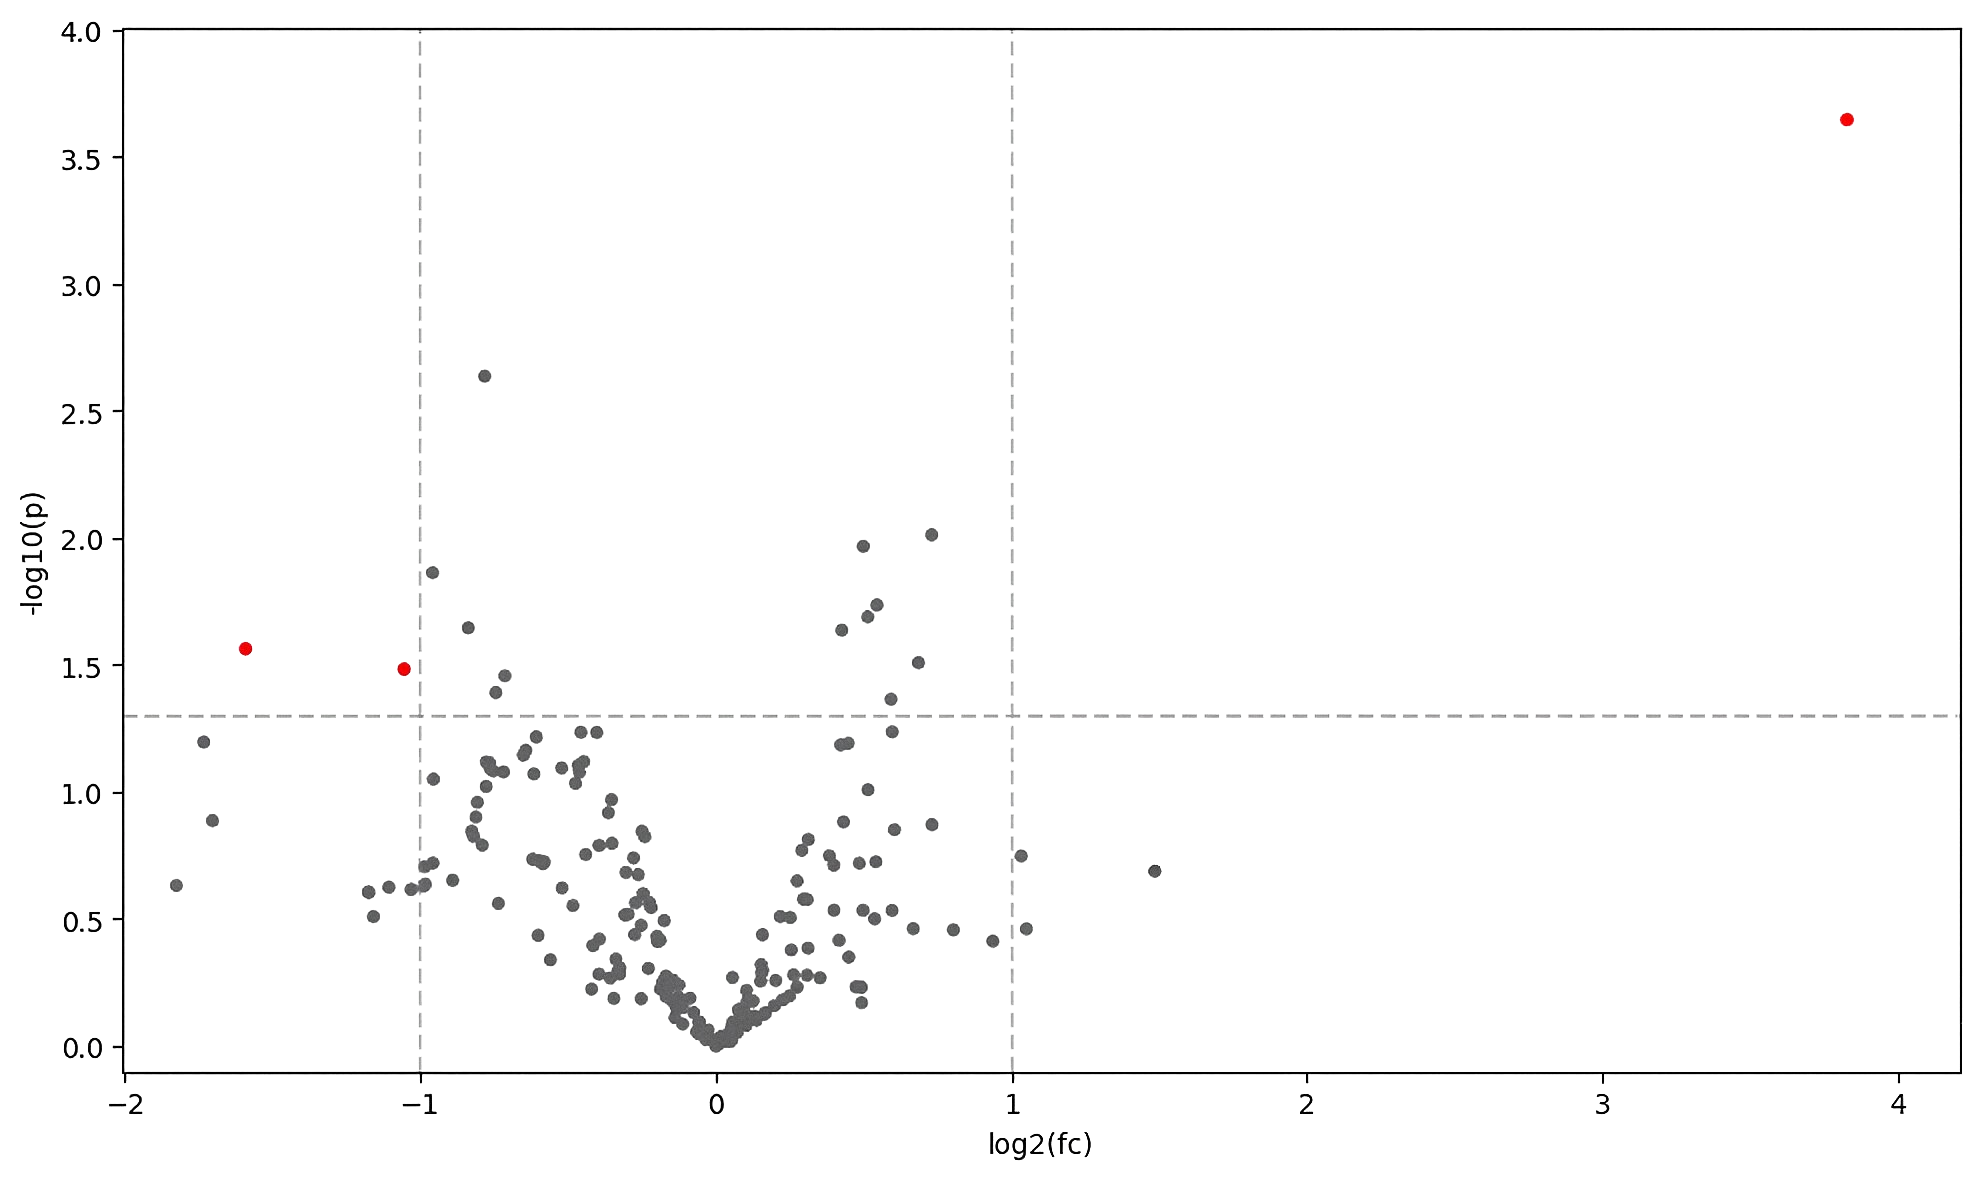
Figure 4: Volcano plot of altered metabolites. This volcano plot displays downregulated (left side) and upregulated (right side) metabolites in targeted metabolomics comparing colorectal cancer (CRC) to healthy samples, with log₂ fold-change plotted against statistical significance (p-values). This type of scatter-plot is used to visualize statistically significantly change data.
C2-2Specialized Metabolomics Workflows
C2-2-1Lipidomics
Lipids are not only structural components, but they also regulate membrane dynamics, signaling and energy storage.
Next-Generation Lipidomics® is a subset of our Next-Generation Metabolomics offering which enables comprehensive lipid profiling to measure:
- Membrane remodeling
- Lipid-mediated signaling pathways
- Energy metabolism and cellular stress responses
C2-2-2Metabolic Flux Analysis
While steady state metabolomics measures abundance, metabolic flux analysis identifies pathway activity by tracing labeled substrates through biological systems (DOI: 10.1016/j.cell.2018.03.055). It provides detailed insights into pathway activity, cellular metabolism or nutrients utilization across diverse biological systems.
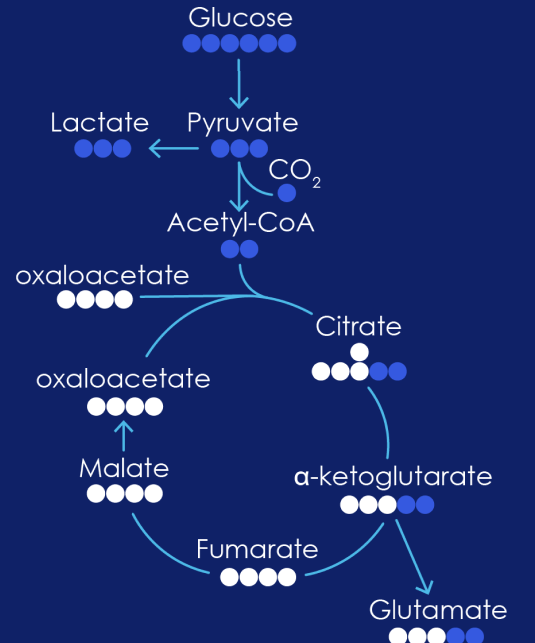
Figure 5: Glycolytic Pathway. Metabolic Flux delivers a dynamic view of metabolism, using stable isotope tracers.
Flux analysis capabilities include:
- Pentose phosphate pathway
- Tricarboxylic acid (TCA) cycle & reductive carboxylation
- Glycolysis
- Bioprocessing applications
C2-2-3Microbiome Function Metabolomics
The microbiome plays a crucial role in shaping host metabolism, immunity and disease susceptibility. Microbiome Function analysis leverages metabolomic workflows purpose built to characterize microbial metabolism and it’s interaction with the host, providing a deeper understanding of how microbial communities influence physiological and pathological processes.
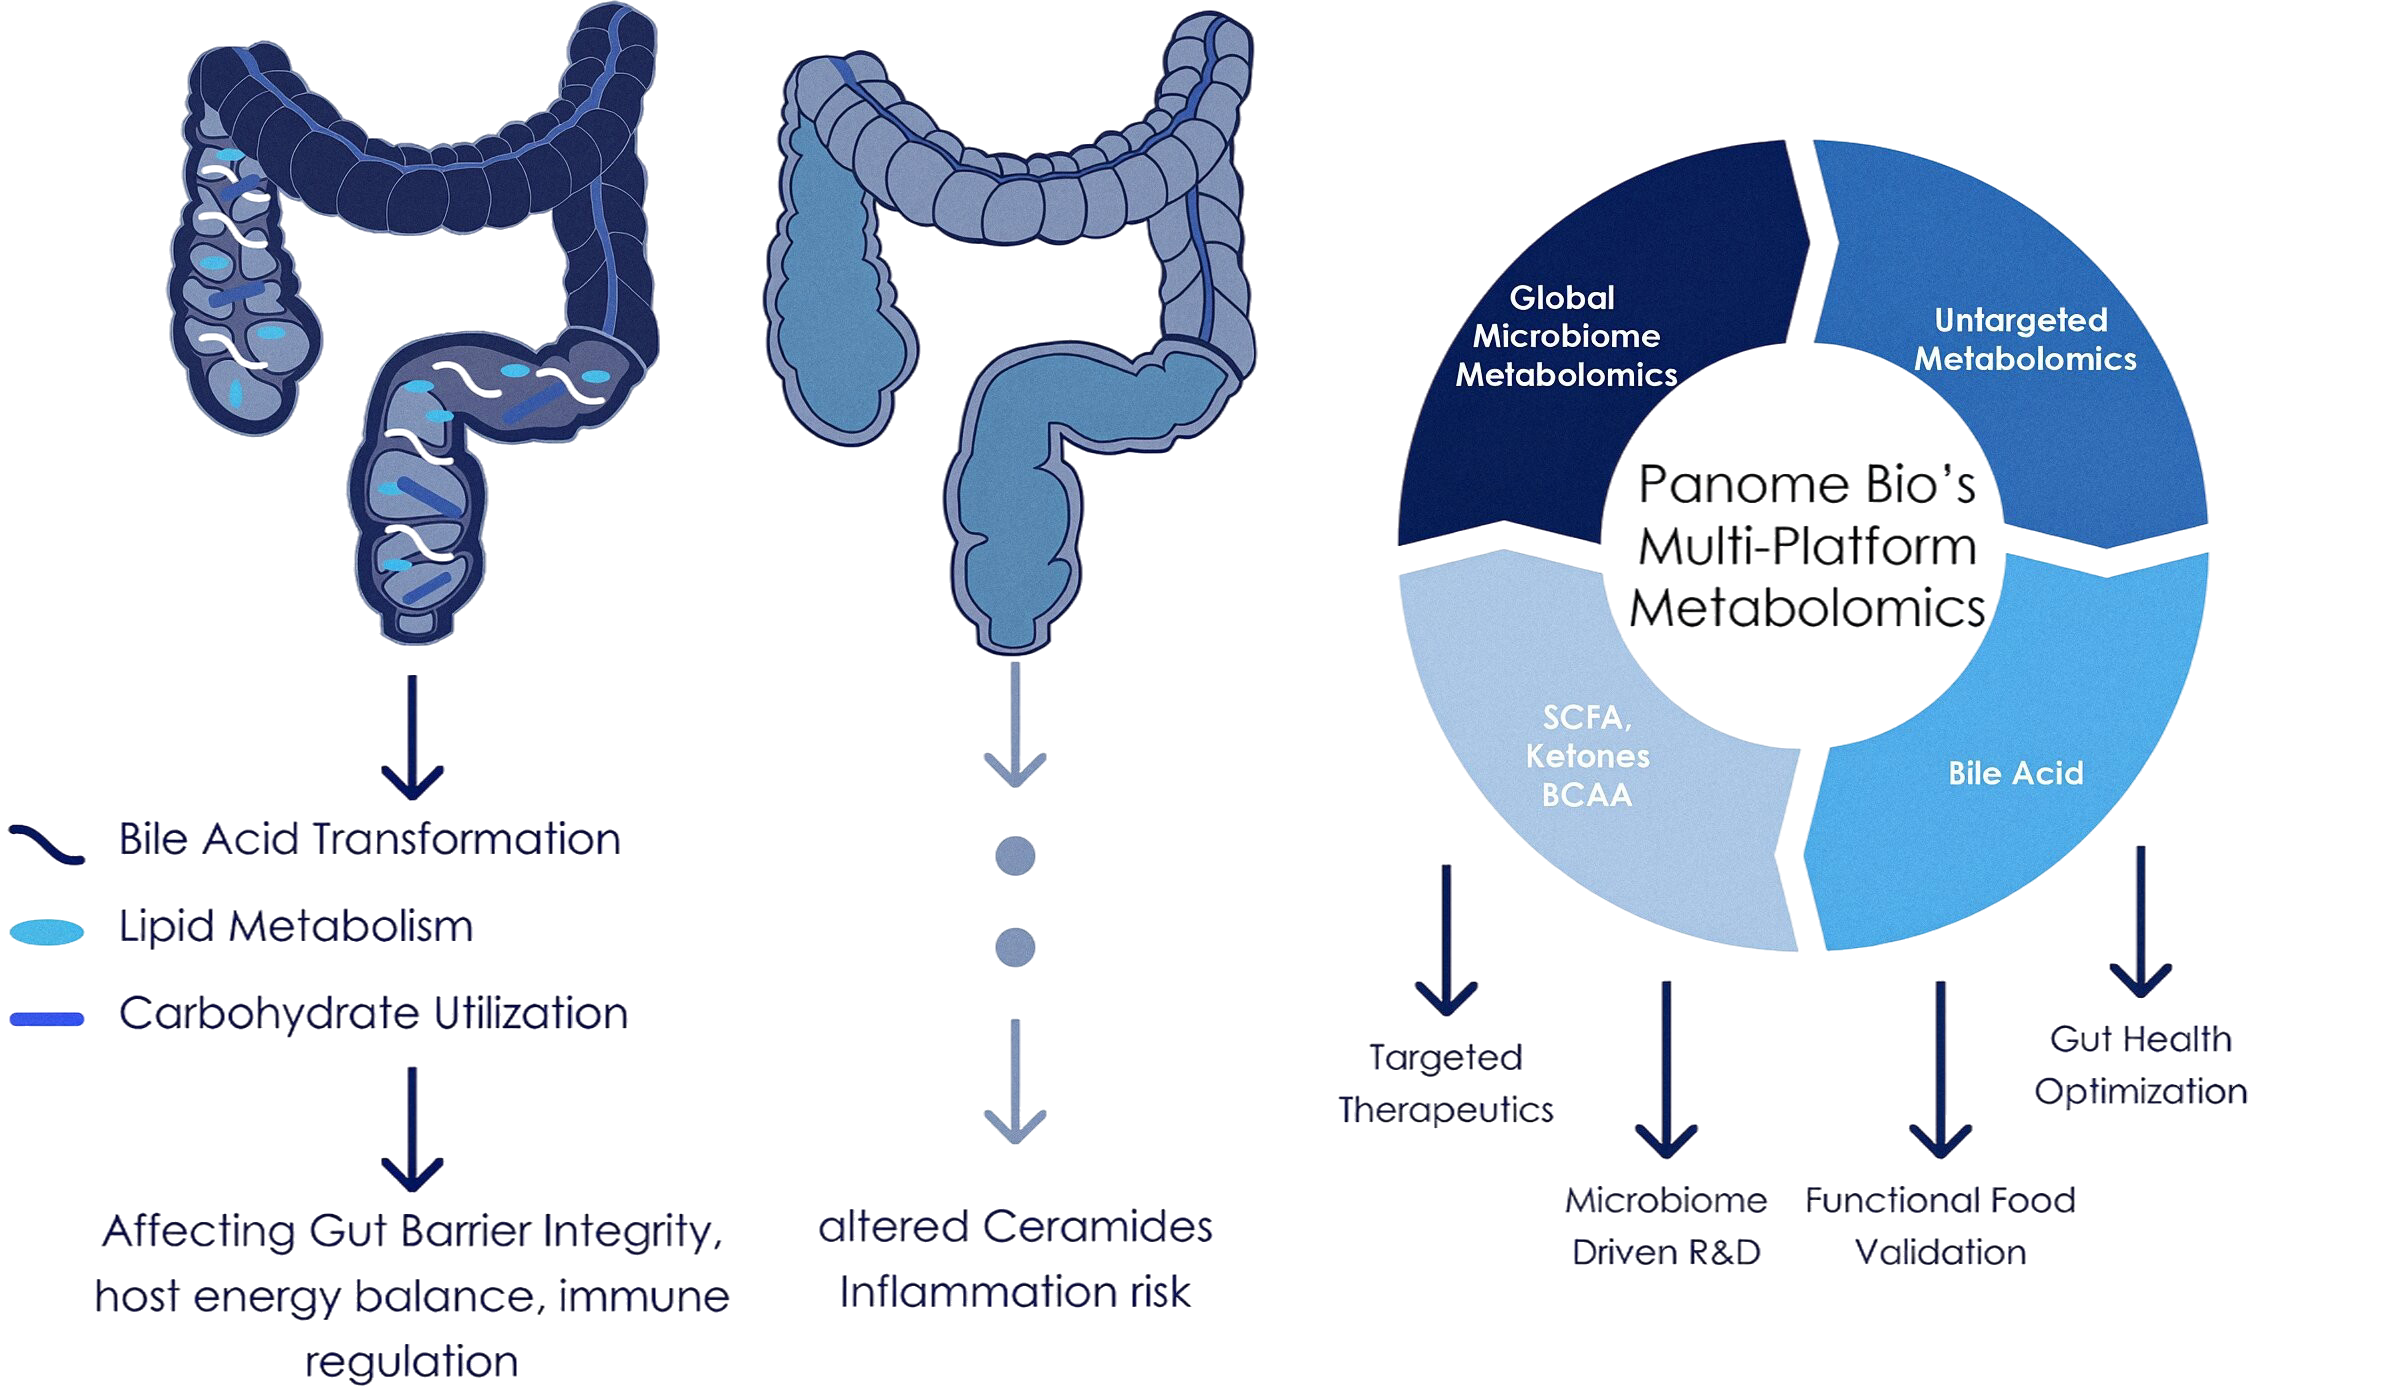
Figure 6: Systemic Impact of Microbiome Disruption. From microbial collapse to molecular clarity, Panome Bio transforms complex signals into actionable discoveries.
Through integrated microbiome–metabolome profiling, researchers can understand:
- Microbial contribution to host metabolic pathways
- Gut–brain and gut–liver metabolic communication
- Diet- and drug-induced microbiome modulation
- Biomarker discovery across diverse biological and environmental systems
C3Proteomics: From Molecular Machines to Mechanism
Proteomics is the comprehensive study of proteins, the molecular machines that execute nearly all cellular functions. While the genome defines potential, proteins determine what happens in the cell (DOI: 10.1038/nature19949).
Proteomics complements metabolomics by providing:
- Direct functional readouts of enzymes, receptors and structural proteins
- Post‑translational regulation, including phosphorylation and acetylation
- Critical insight for drug discovery, since most therapeutics target proteins
- Mechanistic understanding of biological processes across cells, tissues and organisms
C3-1Discovery Proteomics VS. Targeted Proteomics
A central decision in any proteomics study is whether to use Discovery Proteomics or Targeted Proteomics.
C3-1-1Discovery Proteomics
- Broad profiling of thousands of proteins per sample
- Ideal for hypothesis-free exploration
- Identifies candidate biomarkers, pathways and drug targets
Most successful programs use Discovery Proteomics to identify candidates, followed by targeted proteomics for validation. In a case study, Panome Bio identified ~7,000 unique proteins in WT and KRAS HCT-116 cells, with clear separation between groups. Differential analysis measured 74 significantly altered proteins, with pathway analysis highlighting metabolism as the most upregulated pathway in KRAS samples. Read the full report Untargeted proteomics applied to HCT-116 cells.
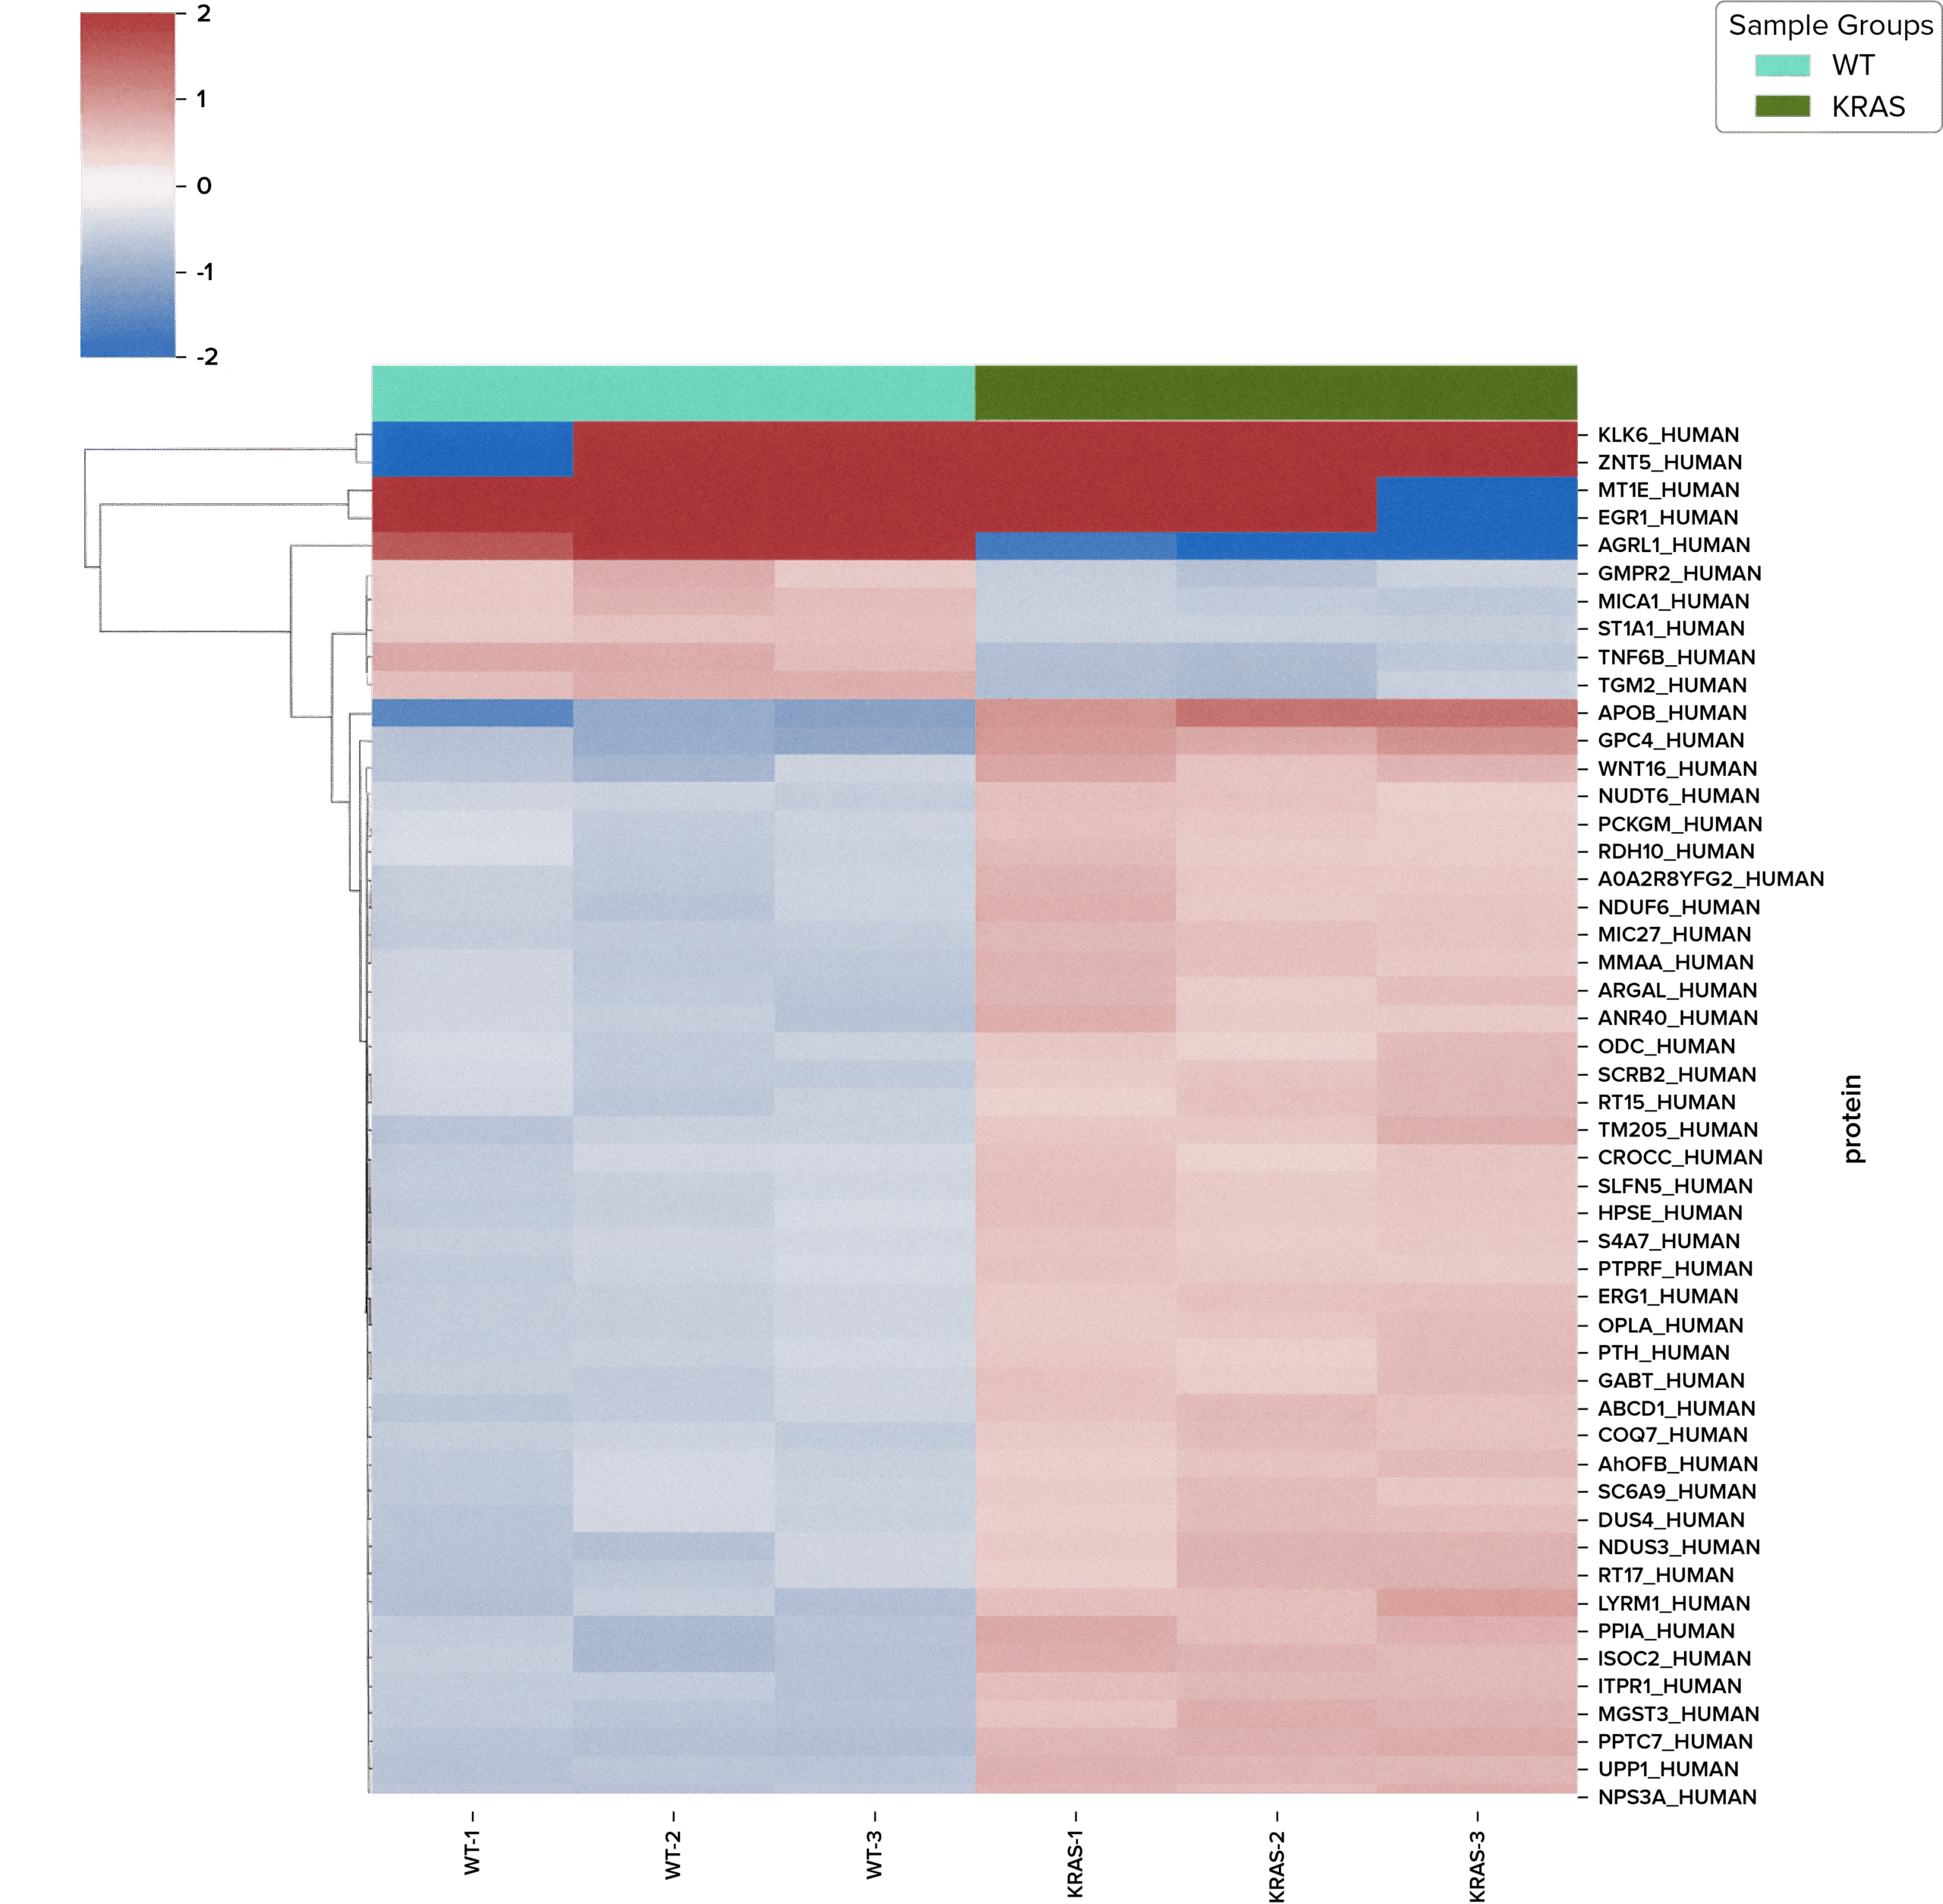
Figure 7: Heatmap of 50 top differentially expressed proteins. This heatmap displays the relative abundances of significantly altered proteins, across experimental groups. Box color represents mean expression levels, with red indicating upregulation and blue indicating downregulation.
C3-1-2Targeted Proteomics
- Precise quantification of predefined protein panels
- High sensitivity and accuracy with superior reproducibility
- Best for validation, longitudinal studies and clinical translation
Discovery proteomics is the starting point for exploratory research, generating rich datasets that characterize which proteins drive your phenotype of interest and then apply targeted proteomics for validation.
Discovery vs. Targeted Proteomics whether you’re exploring untargeted proteomics to obtain a comprehensive overview of protein expression or applying targeted proteomics for precise measurement of specific proteins, selecting the right approach depends on your research goals. Our Proteomics Brochure provides clear guidance to help you determine which method best fits your study’s objectives.
C3-2Global Phosphoproteomics
Protein abundance alone doesn’t identify whether signaling pathways are active. Phosphorylation, one of the most critical post-translational modifications, controls enzyme activity, protein localization and signal transduction.
Global Phosphoproteomics maps phosphorylation events across the entire proteome, revealing which signaling pathways are active, which kinases are engaged and how cells respond to stimuli in real time.
- Active signaling pathways
- Kinase activity and regulation
- Drug mechanism-of-action and resistance mechanisms
Application spans a wide range of research areas including cell signaling, drug discovery, immunology, neuroscience and systems biology.
Panome Bio’s Global Phosphoproteomics platform quantifies tens of thousands of phosphorylation sites, providing a detailed view of cellular signaling dynamics.
Figure 8: Motif plots of phosphorylation events. Motif plots visualize recurring amino acid sequence patterns surrounding modified residues, helping identify kinase recognition preferences and signaling signatures. Here, statistically significant phosphoserine (pS), phosphothreonine (pT) and phosphotyrosine (pY) sites are shown, separated into upregulated and downregulated events. The central position represents the modified residue, with surrounding upstream and downstream amino acids displayed and colored by their chemical properties.
C4Transcriptomics: Capturing Gene Regulation in Motion
Transcriptomics measures RNA expression to reveal which genes are actively being transcribed at a given moment. Unlike static genomic DNA, the transcriptome is highly dynamic and responsive to environmental conditions, biological states and experimental treatments.
Transcriptomics is especially valuable for:
- Understanding gene regulation
- Identifying cell states and heterogeneity
- Discovering coordinated gene expression programs
- Complementing proteomics and metabolomics
Because mRNA levels don’t always predict protein abundance or metabolic activity, transcriptomics is most powerful when integrated with other omics layers.
C5Exposomics: Measuring the Environmental Dimension of Health
The exposome represents the totality of environmental exposures experienced over a lifetime, including diet, pollutants, medications, microbiome-derived compounds and lifestyle factors. Exposomics, introduced in 2005 (DOI: 10.1158/1055-9965.EPI-05-0456) as a complement to the human genome, focuses on measuring these exposures alongside their biological effects and is a rapidly growing field.
Genetic variation explains only a portion of disease risk. Environmental factors account for much of the remaining variability, influencing biological responses, health outcomes and response to chemical or pharmacological exposures (DOI: 10.1038/s44321-025-00191-w). Exposomics provides a systematic way to study these effects.
Figure 9: Chemical Exposure Sources. Overview of exposures contributing to the human exposome, including industry, household products, food, beverages and air, among others.
C5-1Discovery ExposomicsTM vs Targeted ExposomicsTM
Panome Bio provides complementary workflows that support both broad chemical screening and precise exposure measurement.
C5-1-1Discovery Exposomics
Discovery Exposomics is Panome Bio’s ‘broad net’. It screens for over 32,000+ compounds, including PFAS, microplastics and food additives.
This approach is particularly useful for:
- Identifying previously unrecognized environmental exposures
- Exploring chemical contributions to biological variability
- Generating hypotheses in large population or cohort studies
C5-1-2Targeted Exposomics
Targeted Exposomics is for when precision is non-negotiable, providing absolute quantification for 235 priority compounds that are known or suspected to influence biological systems, with high sensitivity at the pg/mL level.
This workflow is commonly used for:
- Quantifying high-priority environmental compounds
- Exposure verification in epidemiological studies
- Monitoring known toxicants, pollutants or dietary compounds
By combining discovery and targeted strategies, researchers can first identify candidate exposures and then quantify them with high confidence.
Figure 10: Exposomics measures internalized chemicals that influence human health. Panome Bio’s Discovery Exposomics screens 32,000+ chemical compounds for broad exposure profiling, while Targeted Exposomics precisely measures 235 high-priority chemicals at trace levels.
C6Multi-Omics: Integrating Biological Systems
Multi-omics is an approach that integrates data across multiple omics layers to enable systems-level understanding of biology.
Each layer contributes to a different question:
- Genes: What could happen?
- Transcripts & proteins: What is being regulated?
- Metabolites: What is actually happening?
- Exposome: What external factors are driving change?
Figure 11: Multi-Omics Data Integration. Panome Bio’s Multi-Omics sophisticated data analysis tools and proprietary databases are used to integrate each omics layer into a singular dataset for deeper biochemical pathway coverage.
C6-1When Should You Use Multi-Omics?
Multi-omics is not always the starting point of a study. In most cases, it becomes valuable when a single data type cannot fully explain a biological observation.
A multi-omics approach is typically appropriate when:
- A phenotype is clearly observed but the mechanism is unclear
- Transcriptomics or proteomics alone do not explain functional outcomes
- Metabolic changes appear disconnected from genetic or protein-level changes
- Environmental or treatment effects cannot be interpreted from a single layer
- Biomarker discovery requires cross-validation across molecular systems
In these cases, multi-omics shifts the analysis from describing changes to explaining how those changes are connected across biological layers (DOI: 10.1016/j.aca.2020.10.038).
C6-2Interpreting Multi-Omics Results
The goal of multi-omics is not simply to combine datasets, but to identify where biological agreement occurs across layers.
Key interpretation questions include:
- Do changes in RNA translate into protein-level changes?
- Are metabolic shifts consistent with upstream signaling or gene regulation?
- Do environmental exposures map to measurable internal biological responses?
- Where do datasets disagree—and what does that reveal about regulation or timing?
These comparisons often characterize biology that is invisible in single-omics analysis, especially when regulation occurs post-transcriptionally or through metabolic rewiring.
When multi-omics data is aligned correctly, it becomes possible to reconstruct biological structure rather than isolated signals.
This enables researchers to:
- Map complete pathways from exposure → gene regulation → protein activity → metabolic outcome
- Identify upstream drivers of disease states
- Separate causal changes from secondary effects
- Prioritize biomarkers that are consistent across multiple molecular layers
By combining these perspectives, multi-omics helps to identify mechanisms that may remain hidden when studying a single data type.
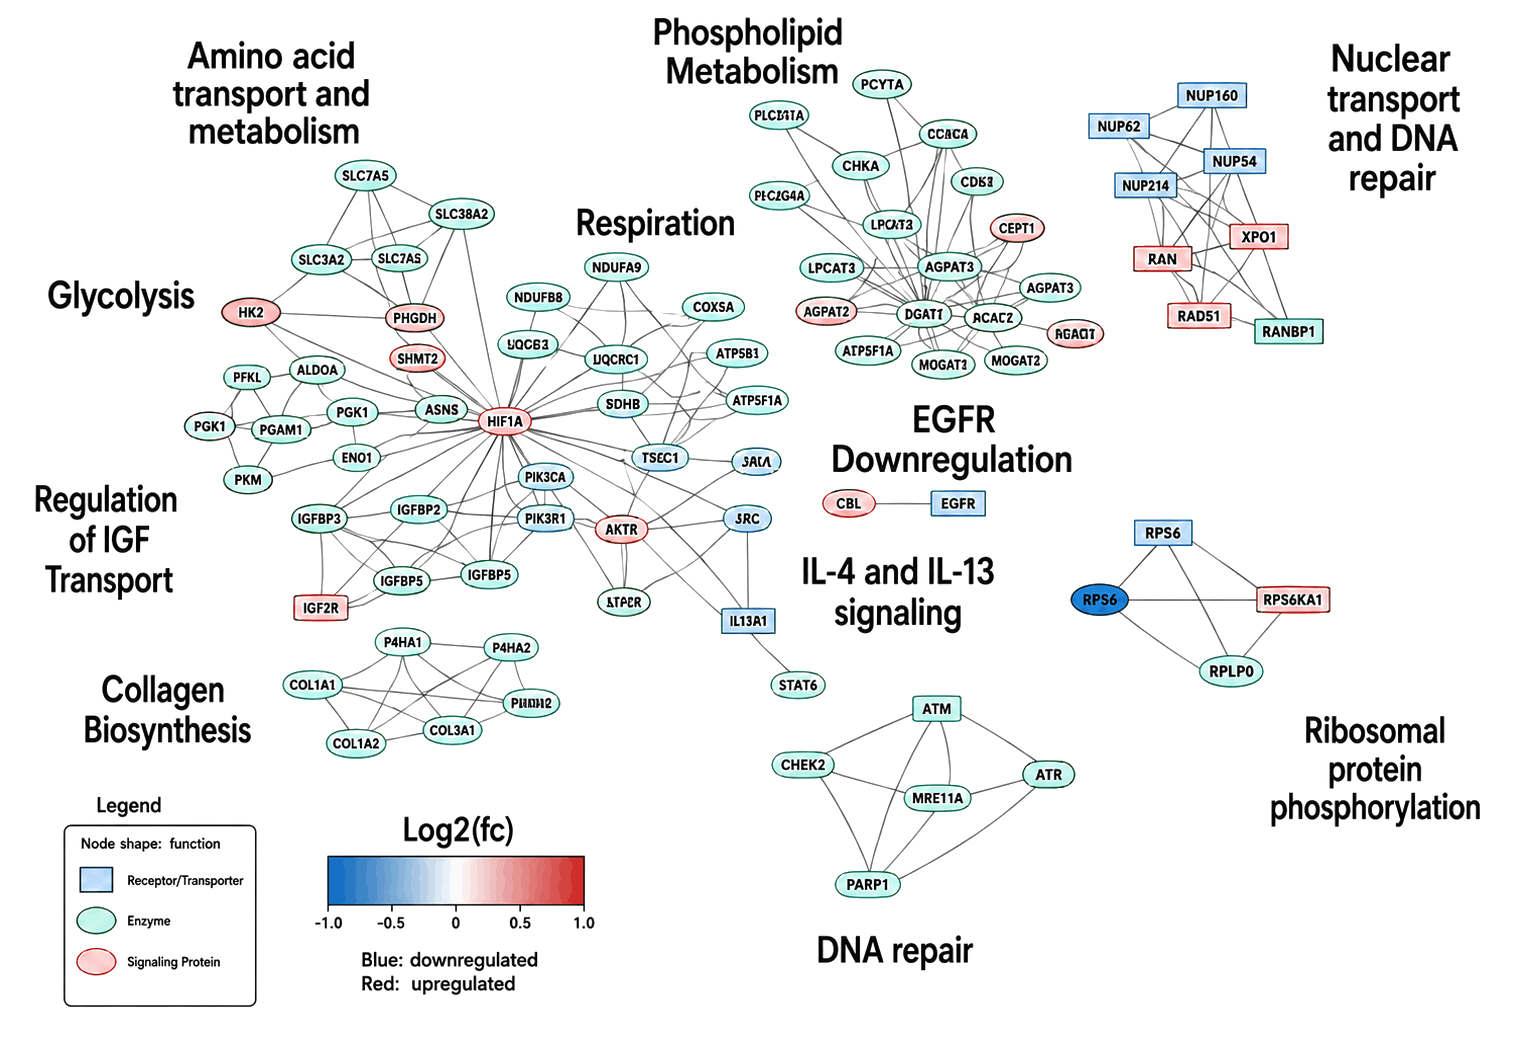
Figure 12: Integrated network. Integrated network plots combine multiple omics layers (e.g., proteomics, metabolomics, transcriptomics) into a unified map to reveal relationships between molecules and biological pathways. By connecting related features across datasets, these networks help identify key drivers, pathway interactions and system-level changes. Here, Panome Bio’s enables deeper biochemical information through multi-omics integration. For a detailed example, see Panome Bio’s KRAS KD cancer study.
C7Technologies Behind High-Quality Omics Data
The quality of omics data depends entirely on the quality of the underlying technology. Panome Bio combines advanced instrumentation with computational platforms designed to produce accurate and reproducible measurements.
C7-1Mass Spectrometry
Mass spectrometry (MS) identifies and quantifies molecules based on their mass-to-charge ratio, providing unparalleled sensitivity and specificity. Unlike antibody-based assays, MS directly measures chemical structure without requiring prior knowledge of what you’re looking for. MS is the gold standard for metabolomics and proteomics, offering unmatched sensitivity, specificity and structural resolution.
Key capabilities include:
- High-resolution accurate mass spectrometry (HRMS) for precise measurements
- Tandem MS (MS/MS) to confirm identity and distinguish isomers
- Liquid chromatography-MS (LC-MS) separates complex biological mixtures before detection
- Data-dependent acquisition methods for large-scale coverage while maintaining quantitative accuracy
Panome Bio’s instruments are optimized for maximum sensitivity, dynamic range and reproducibility, ensuring you detect even low-abundance biomarkers in complex biological matrices.
C7-2Computational Infrastructure: Turning Data into Discovery
Omics experiments generate millions of data points per study and raw data is just the beginning. Panome Bio’s computational platform converts large-scale datasets into interpretable biological results. MassID a cloud-based proprietary platform integrated accurate mass, fragmentation patterns and chromatographic behavior with a reference database of over 280,000 compounds. It enables false discovery rate controlled reproducible metabolomics for big cohorts and processing raw data into validated biological results through structured analysis workflows.
This infrastructure supports:
- Machine learning-based identification workflows
- Quality-controlled annotations
- Pathway and network analysis
- Biomarker discovery
- Interactive data visualization
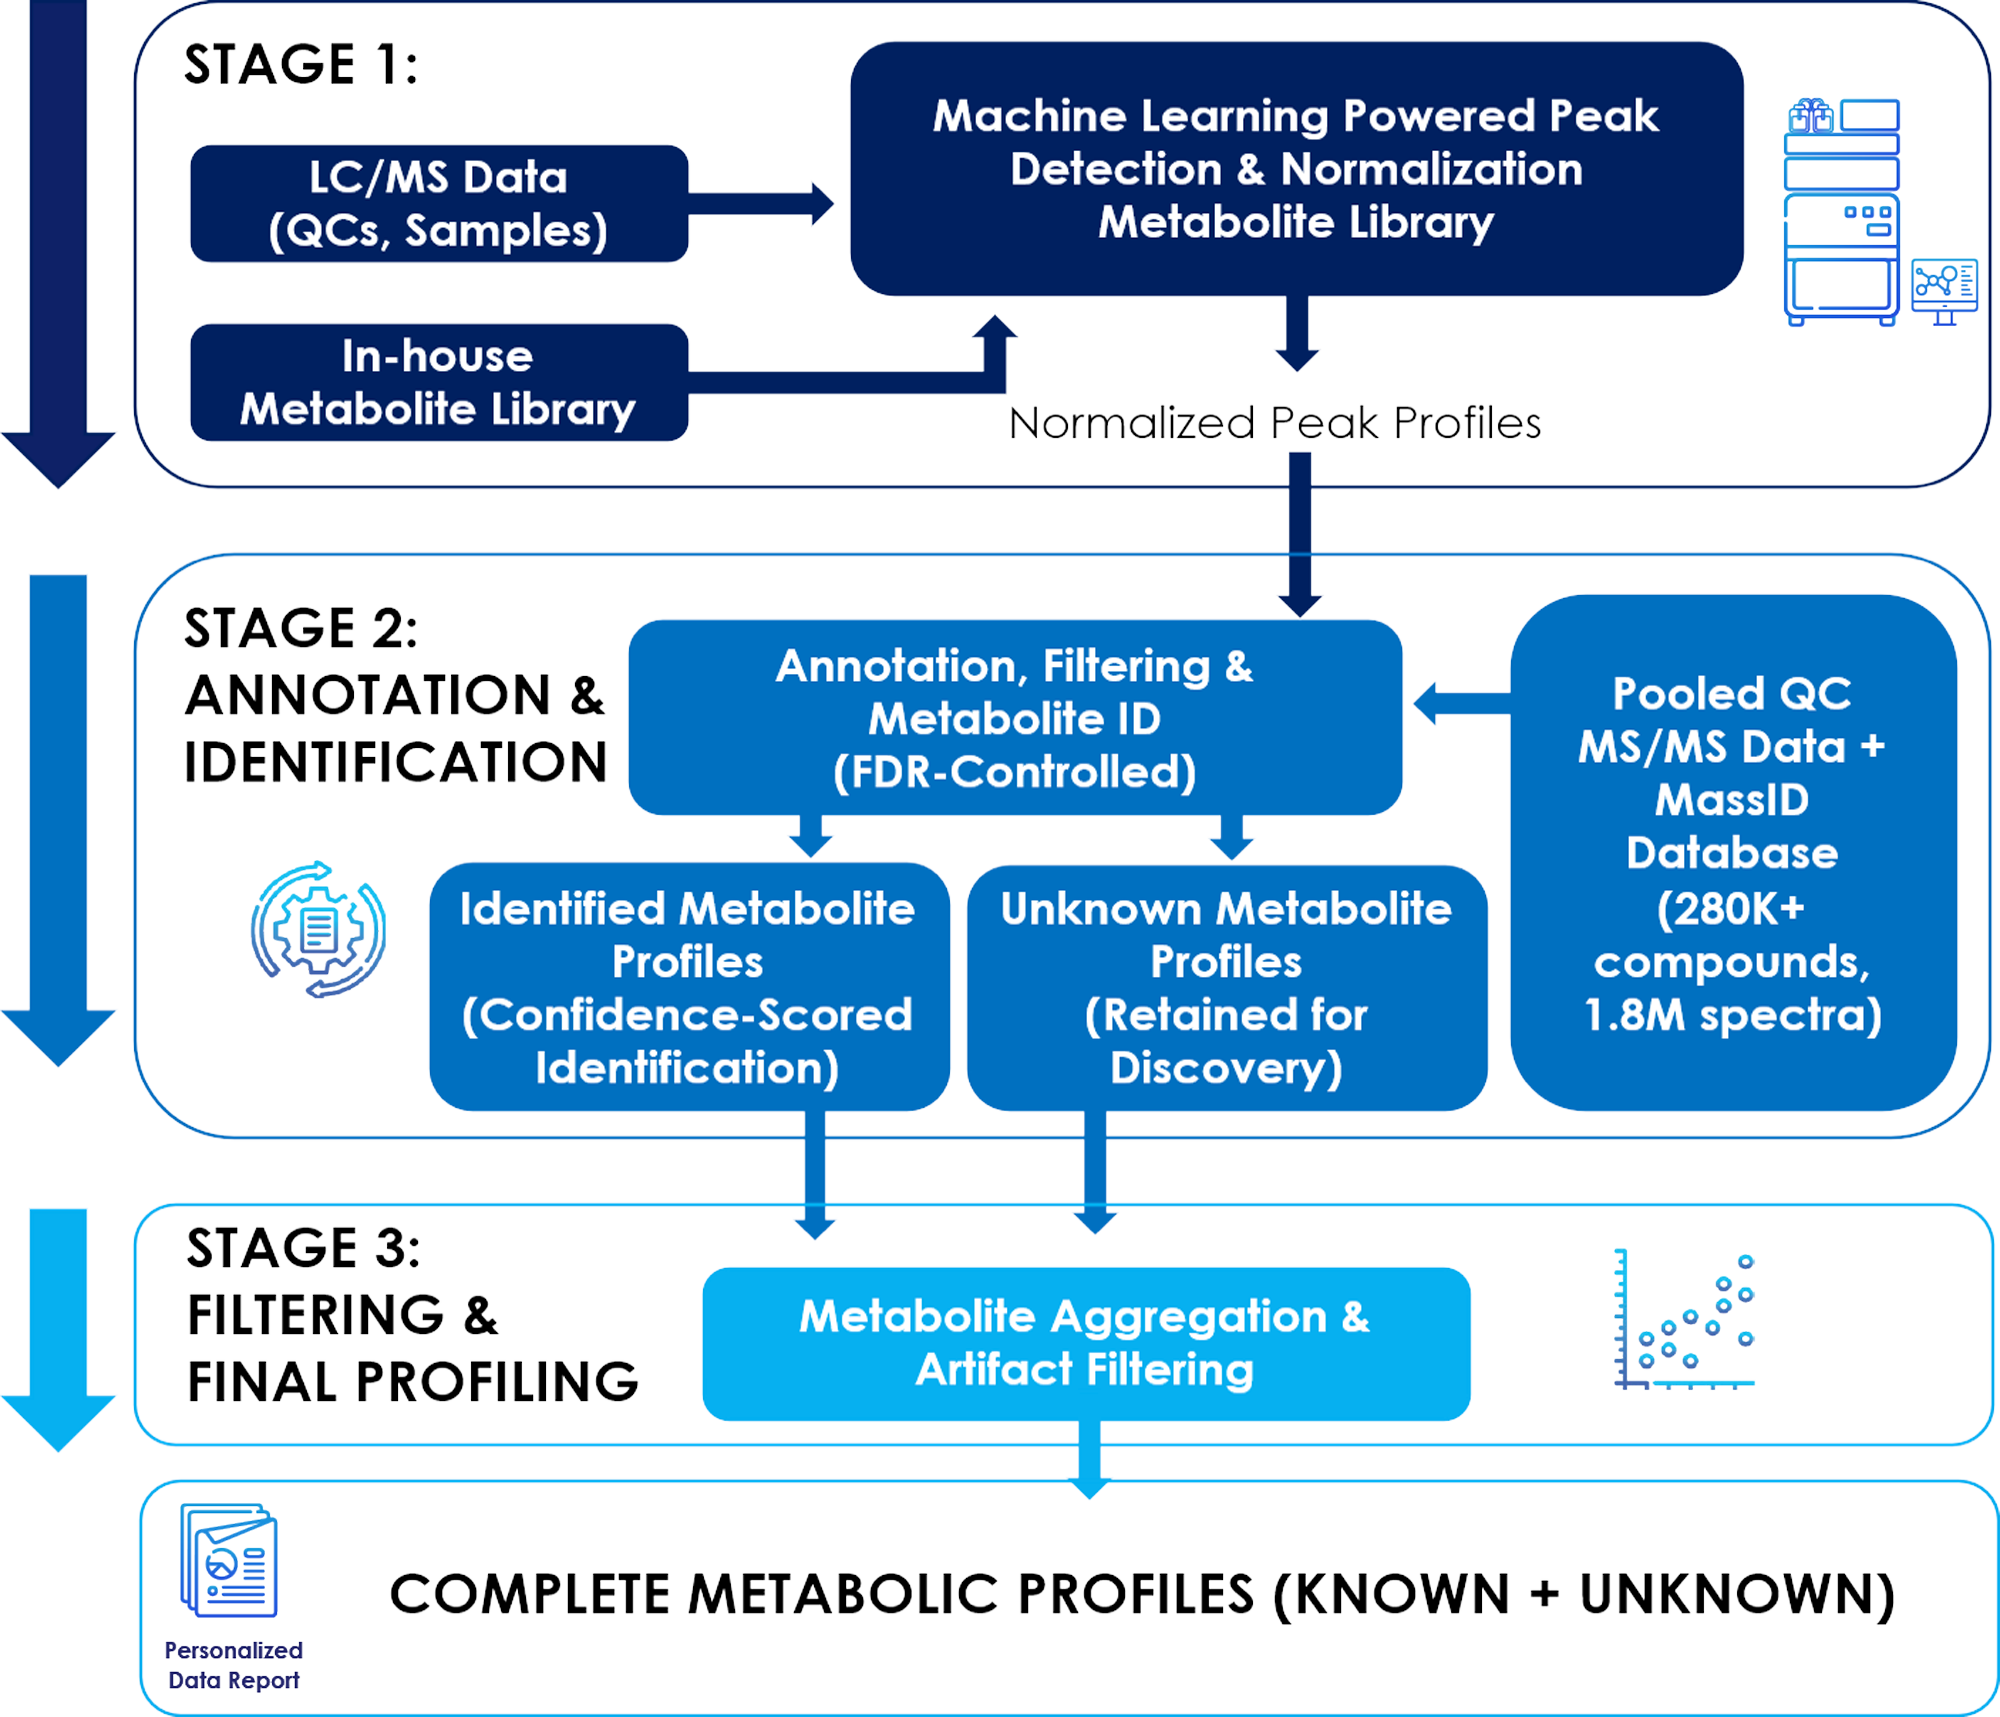
Figure 13: MassID Workflow. MassID performs machine-learning based signal detection, normalization, noise removal and probability-based identification with FDR (false discovery rate) control to generate complete, discovery-ready metabolic profiles.
C8Design and Interpreting Omics Study
Even the best technology can’t compensate for poor experimental design. Successful studies start with the right design.
Key design considerations include:
- Clear biological questions: Define whether the study aims to discover novel mechanisms, identify biomarkers or validate known pathways.
- Selection of appropriate omics layers: Different technologies provide complementary biological perspectives. Choosing the right combination depends on the research objective.
- Sample Quality and experimental consistency: Sample handling, storage conditions and standardized protocols are essential for reliable results.
- Adequate statistical power: Studies must include sufficient biological replicates to detect meaningful differences and control false discovery rates.
C8-1From Data to Discovery
After data acquisition, analysis typically includes:
- Quality control and normalization: Correct for technical variation and identification of outlier samples.
- Statistical testing: Identification of molecules that differ significantly between biological groups.
- Pathway and network analysis: Mapping molecular changes to biological pathways to reveal coordinated functional responses.
- Validation: Confirming key findings through targeted assays independent cohorts or functional experiments.
C9Applications of Omics Technologies
Omics technologies are widely applied across research and industry, just to mention a few areas.
Drug Discovery:
- Target identification
- Mechanism-of-action
- Biomarker development
- Safety and toxicology
Clinical and Translational Research:
- Precision medicine approaches
- Early disease detection
- Monitoring therapeutic response
- Biomarker discovery for cancer, cardiovascular, metabolic, or neurodegenerative diseases
- Immune system modulation and inflammatory disease studies
Environmental and Agricultural Research:
- Chemical and environmental exposure monitoring
- Urban health, pollution, and climate impact studies
- Public health surveillance, epidemiology and regulatory toxicology
- Crop stress biology
- Microbial ecosystem analysis
Nutrition and Microbiome:
- Gut microbiome profiling for dietary impact
- Nutrient-microbiome interactions
- Personalized nutrition strategies
- Prenatal, maternal, and early-life exposure assessment
- Aging and longevity research
Industrial Biotechnology & Bioprocessing:
- Enzyme and microbial optimization
- Synthetic biology applications
- Biomanufacturing and fermentation improvements
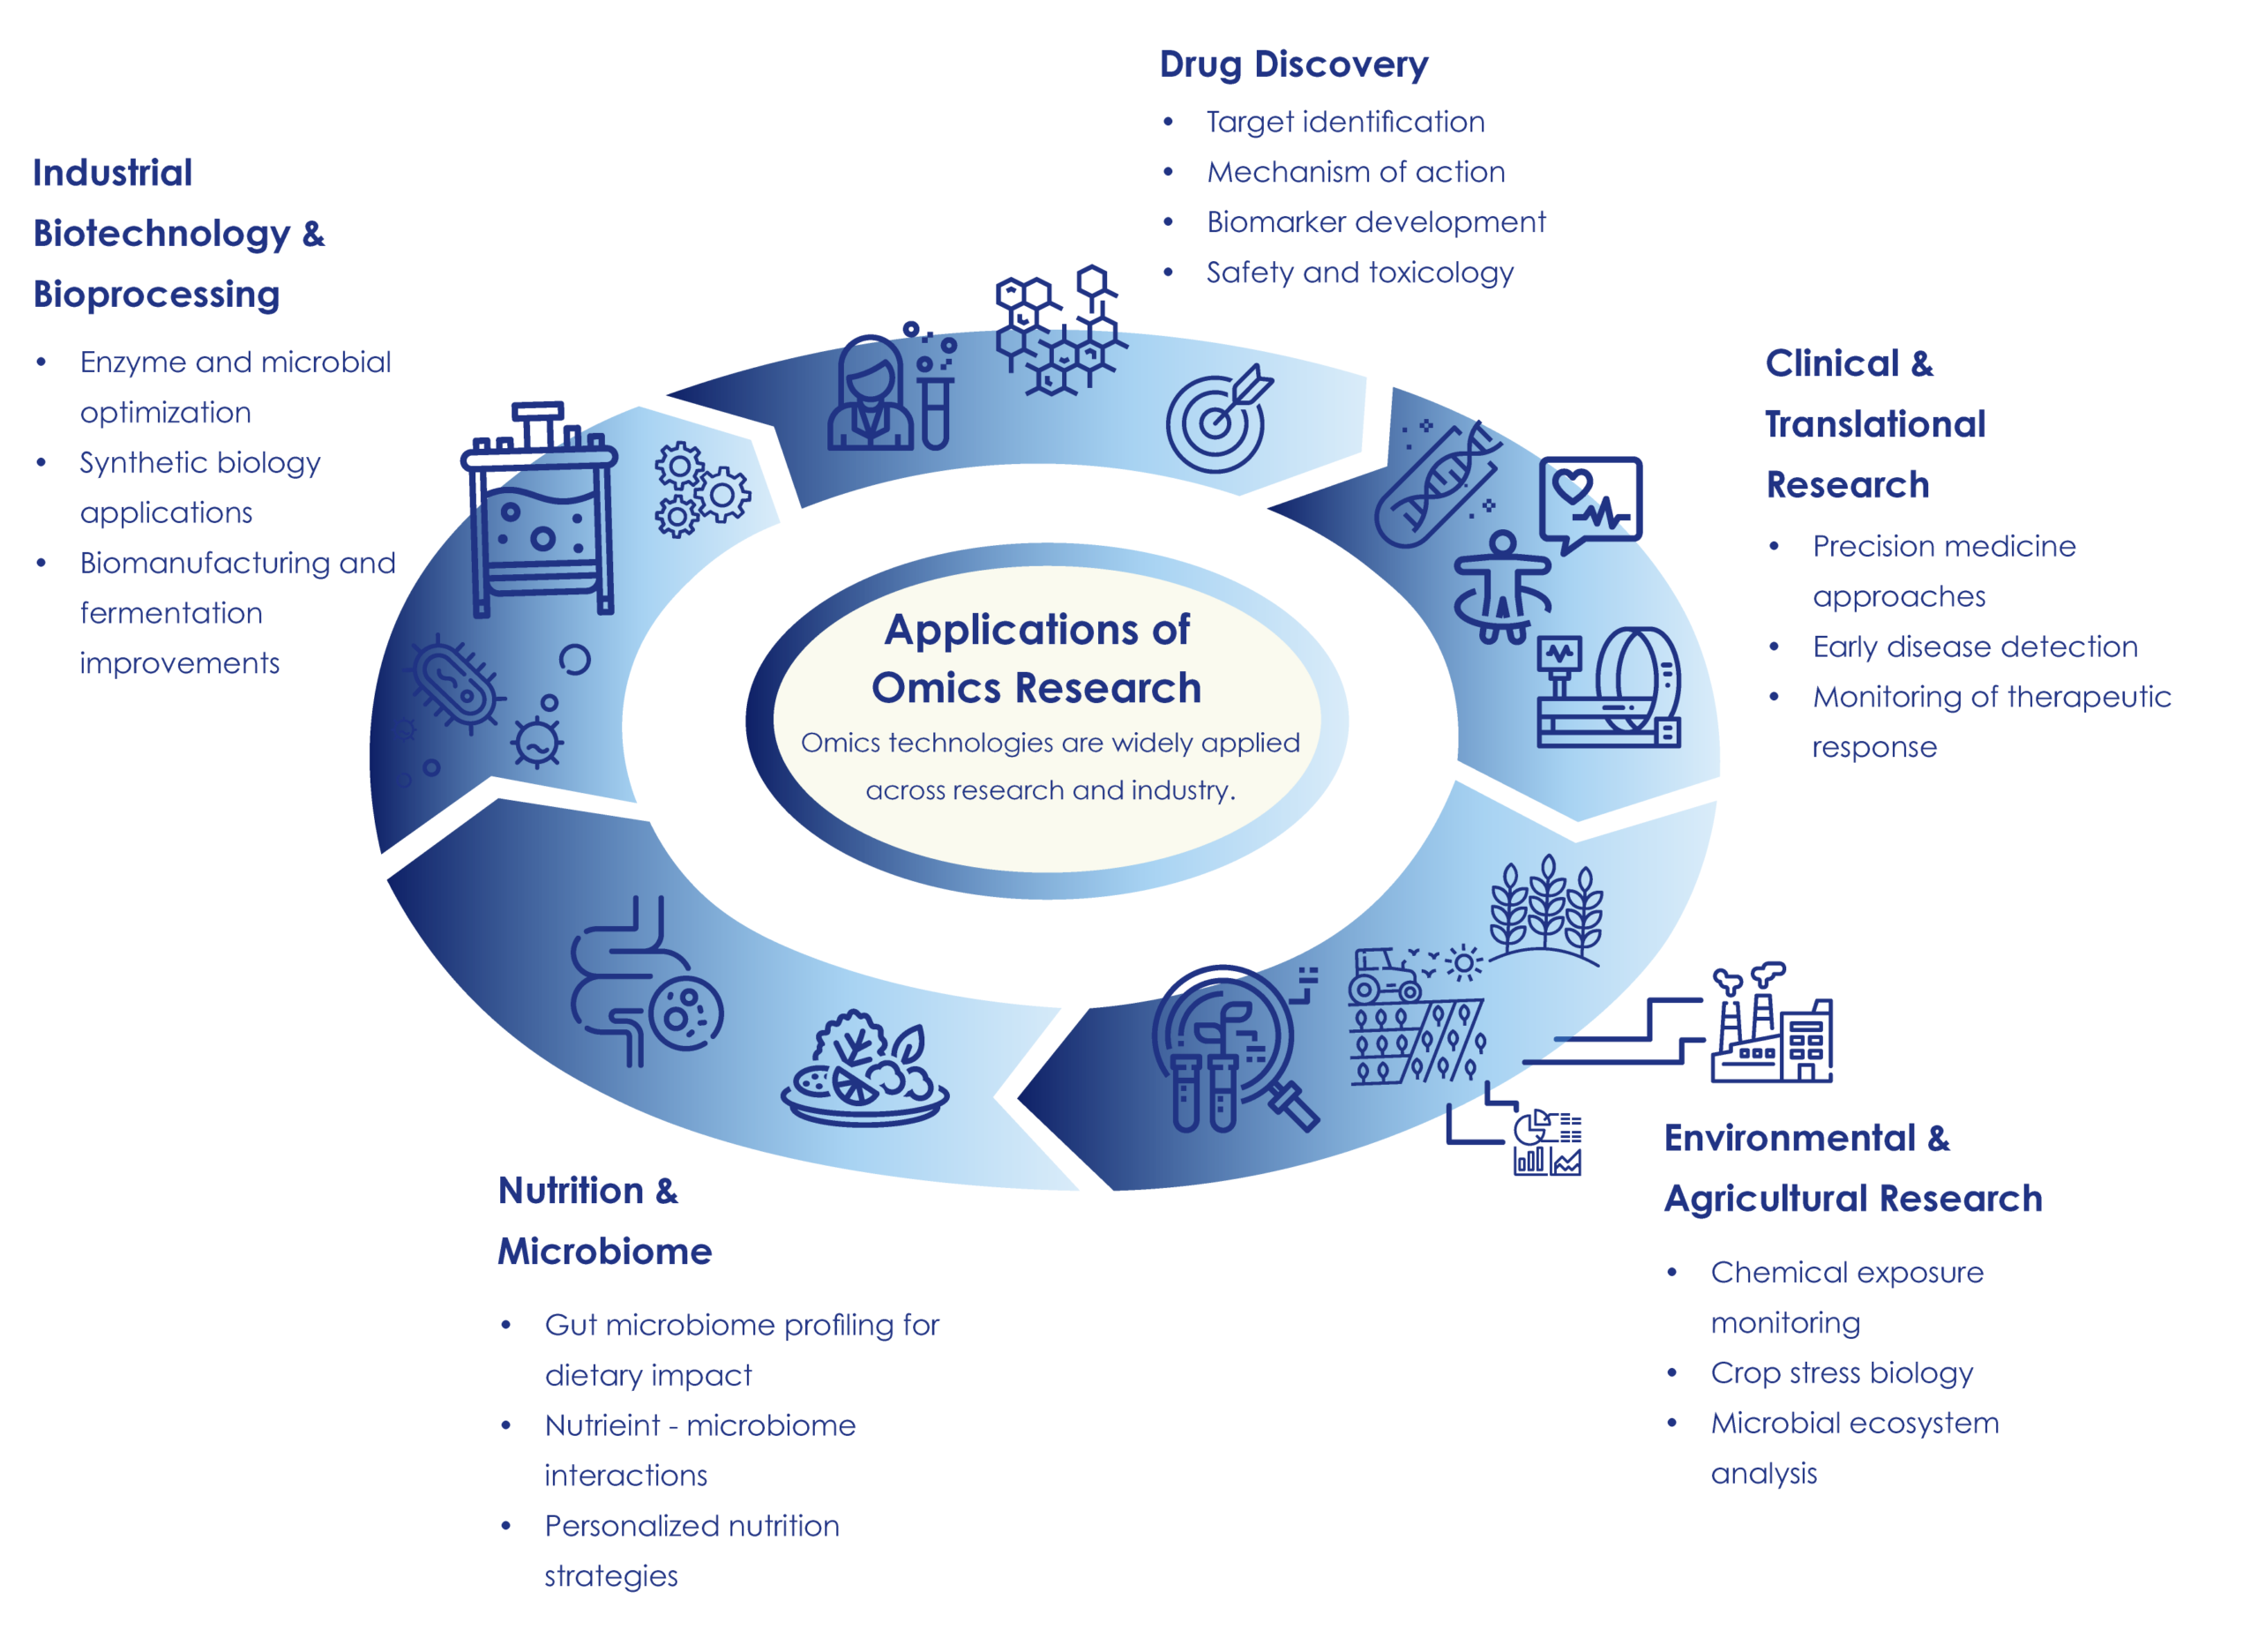
Figure 14: Application of Omics Research. This infographic illustrates five key sectors where omics technologies are widely applied in research and industry: Drug Discovery, Clinical & Translational Research, Environmental & Agricultural Research, Nutrition & Microbiome and Industrial Biotechnology & Bioprocessing, showing example activities within each.
C10Omics Services at Panome Bio
Panome Bio provides integrated omics technologies designed to support biological discovery, translational research and system-level insights. Our platforms are designed to deliver broad molecular coverage, precise measurements and computational power for a wide range of applications.
Key Capabilities:
- Next-Generation Metabolomics and Lipidomics: broad molecular profiling across small molecules and lipids
- Discovery & Targeted Proteomics: profiling proteins for functional and pathway analysis
- Global Phosphoproteomics: mapping signaling pathway activity
- Discovery & Targeted Exposomics: measuring environmental exposures and their biological impact
- Multi-Omics Integration: combining datasets to reveal a system-level view
- Computational Infrastructure & Expertise: transforming raw data into actionable biological insights
- Scientific Collaboration: support from experimental design to data interpretation
C10-1Why Partner with Panome Bio
- Broad Molecular Coverage – our platforms detect hundreds of thousands of molecular features per sample
- Computational Excellence – MassID™ and proprietary pipelines produce validated, publication-ready results
- End-to-End Support – from study design through data interpretation, we provide guidance at every step
- Proven Track Record – our technologies have enabled discoveries across diverse research fields, including oncology, neuroscience, immunology and metabolic research
For additional information or to discuss study design, contact the Panome Bio scientific or request a quote.
Getting started with
Panome Bio is easy
We handle all the
complexities for you
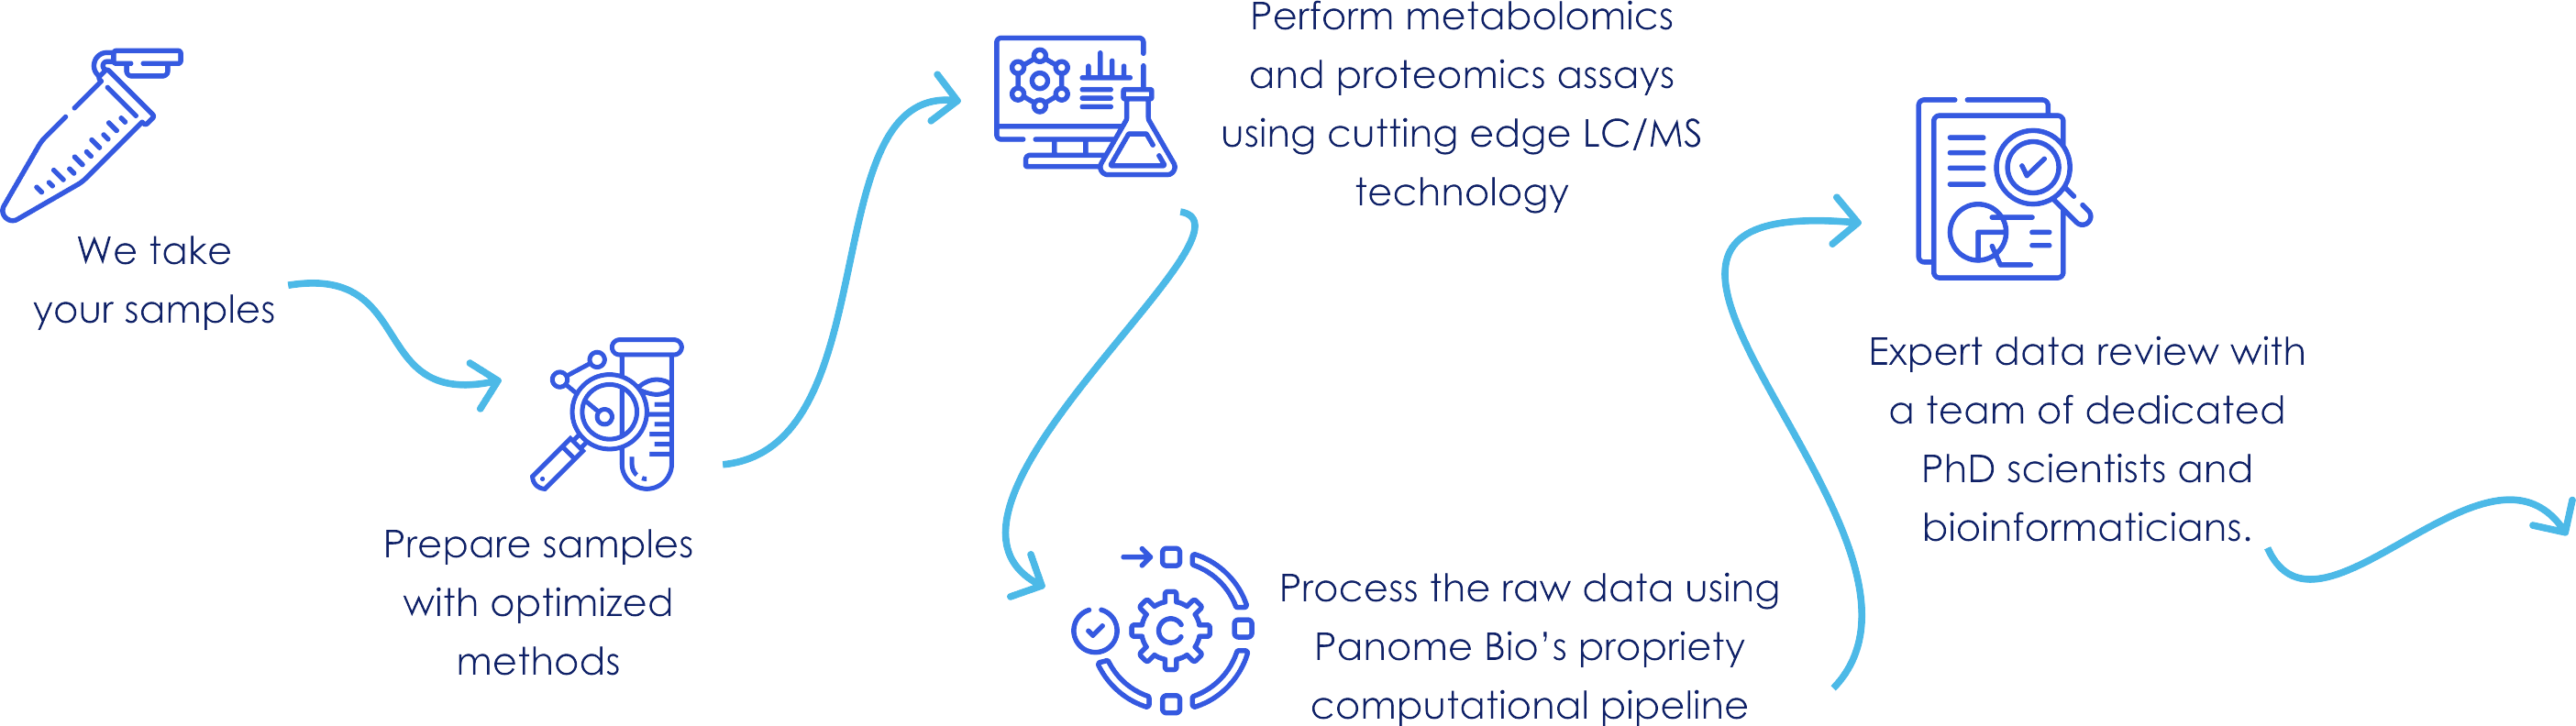
You receive a wealth
of information
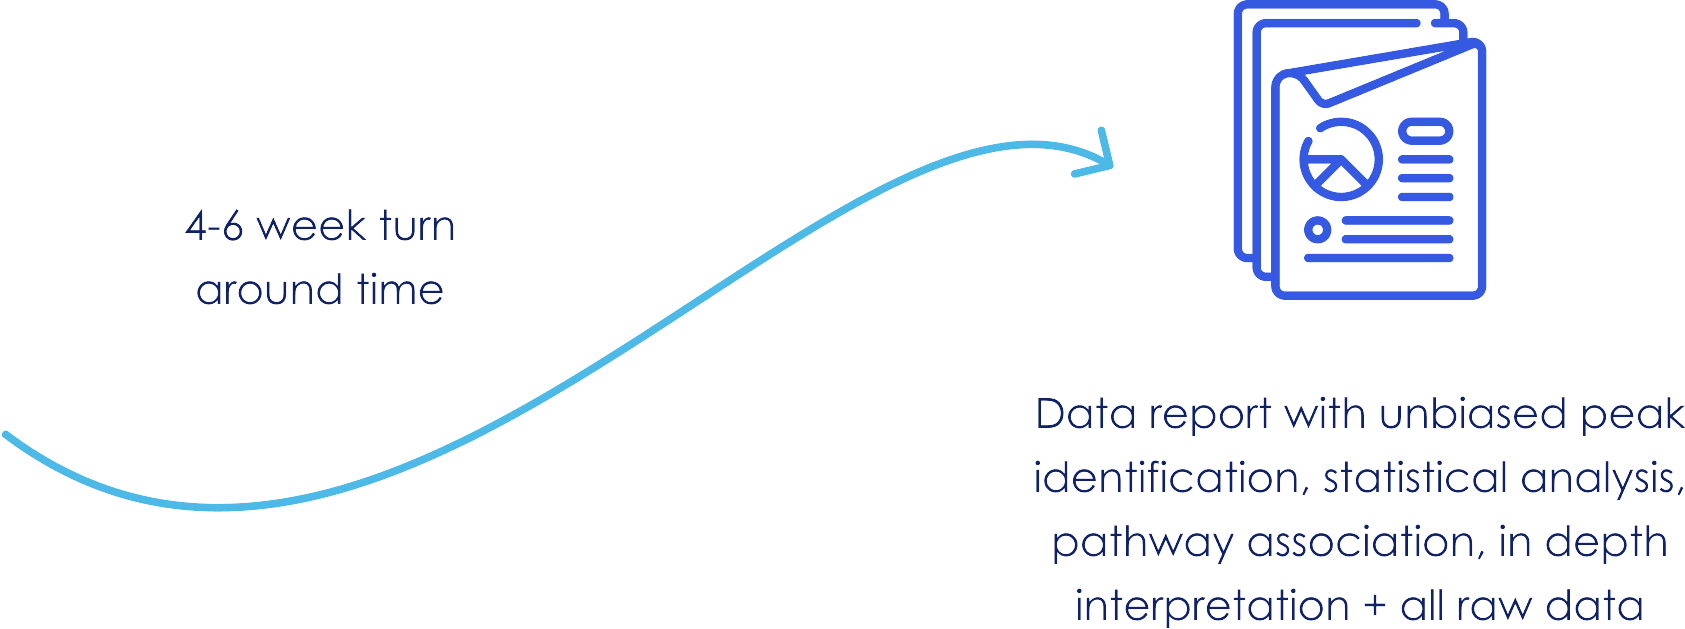
Figure 15: From Sample to Biological Insight. This infographic illustrates five key sectors where omics technologies are widely applied in research and industry: Drug Discovery, Clinical & Translational Research, Environmental & Agricultural Research, Nutrition & Microbiome and Industrial Biotechnology & Bioprocessing, showing example activities within each
C11Frequently Asked Questions About Omics Technologies
What are omics technologies?
Omics technologies are large-scale analytical approaches used to measure thousands of biological molecules simultaneously. They provide a system-level view of how genes, proteins, metabolites and environmental exposures interact in biological systems.
What is the difference between metabolomics and proteomics?
Metabolomics studies small molecules (metabolites) that reflect cellular metabolism and physiological state, while proteomics measures proteins, the molecular machines that carry out biological functions. Together, they reveal different layers of cellular activity.
What is multi-omics analysis?
Multi-omics integrates data from multiple omics layers, genomics, transcriptomics, proteomics, metabolomics and exposomics, to reveal mechanisms that cannot be seen from a single data type.
Why is metabolomics important?
Metabolomics provides a direct readout of biological activity, capturing pathway dynamics, environmental effects and disease-related changes. It helps identify biomarkers, understand mechanisms of action and stratify disease states.
What technologies are used in omics research?
Omics research uses a combination of technologies such as mass spectrometry, next-generation sequencing, chromatography and computational platforms like Panome Bio’s MassID™ to measure, quantify and interpret biological molecules across different omics layers.
How can metabolomics be used for biomarker discovery?
Metabolomics identifies metabolites linked to disease or treatment responses, enabling the discovery of biomarkers that indicate disease presence, progression or therapy effectiveness.
Targeted vs Untargeted Omics?
Targeted and untargeted approaches are central strategies across omics technologies.
- Untargeted approaches measure thousands of molecules or chemicals to enable hypothesis-free discovery. They are ideal for exploratory studies and identifying previously unknown biology or exposures.
- Targeted approaches focus on predefined molecules or compounds for precise quantification, validation and reproducibility.
Many studies use a hybrid strategy: untargeted methods for discovery, followed by targeted assays for confirmation, whether in metabolomics, exposomics or other omics layers.
What is Metabolic Flux Analysis?
Metabolic flux analysis tracks the flow of metabolites through pathways using labeled substrates, revealing dynamic cellular metabolism and pathway activity in real time.
What is exposomics and how is it different from metabolomics?
Exposomics studies all environmental exposures across a person’s lifetime, including chemicals from diet, pollution and lifestyle and measures their effects on biology. Unlike metabolomics, which measures endogenous metabolites to capture cellular function, exposomics focuses on external factors influencing health.
How are exposomics and metabolomics connected?
Metabolomics and exposomics are closely related because many environmental chemicals and their biological effects can be measured through metabolic profiling. Metabolomics is particularly well suited for exposomics studies because it captures both external exposures and the body’s internal response to them.
This includes measuring:
- Exogenous compounds originating from diet, pollution, or pharmaceuticals
- Biotransformation and detoxification products produced by metabolism
- Endogenous metabolic changes associated with environmental exposure
By linking external exposures with internal biochemical responses, the integration of metabolomics and exposomics helps researchers better understand how environmental factors influence human health and disease.
Why is chemical exposure measurement important in disease research?
Many chronic diseases are influenced by environmental chemicals that genetics alone cannot explain. Measuring exposures helps identify risk factors, discover disease-associated chemicals and support precision medicine approaches.
Can exposomics be integrated with multi-omics?
Yes. Integrating exposomics with metabolomics, proteomics and transcriptomics links external exposures to internal biological responses, enabling system-level insights into disease mechanisms and treatment outcomes.