Innovative Multi-Omics Technology
for Unparalleled Insights
Integrated Multi-Omics Analysis
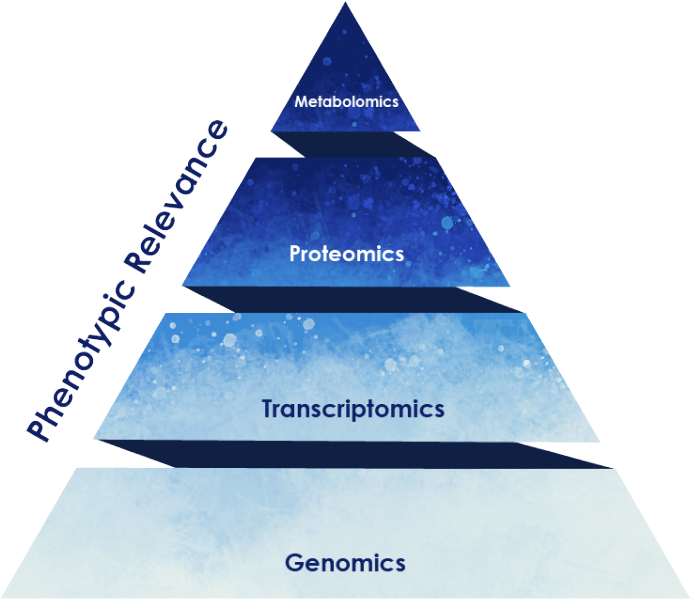
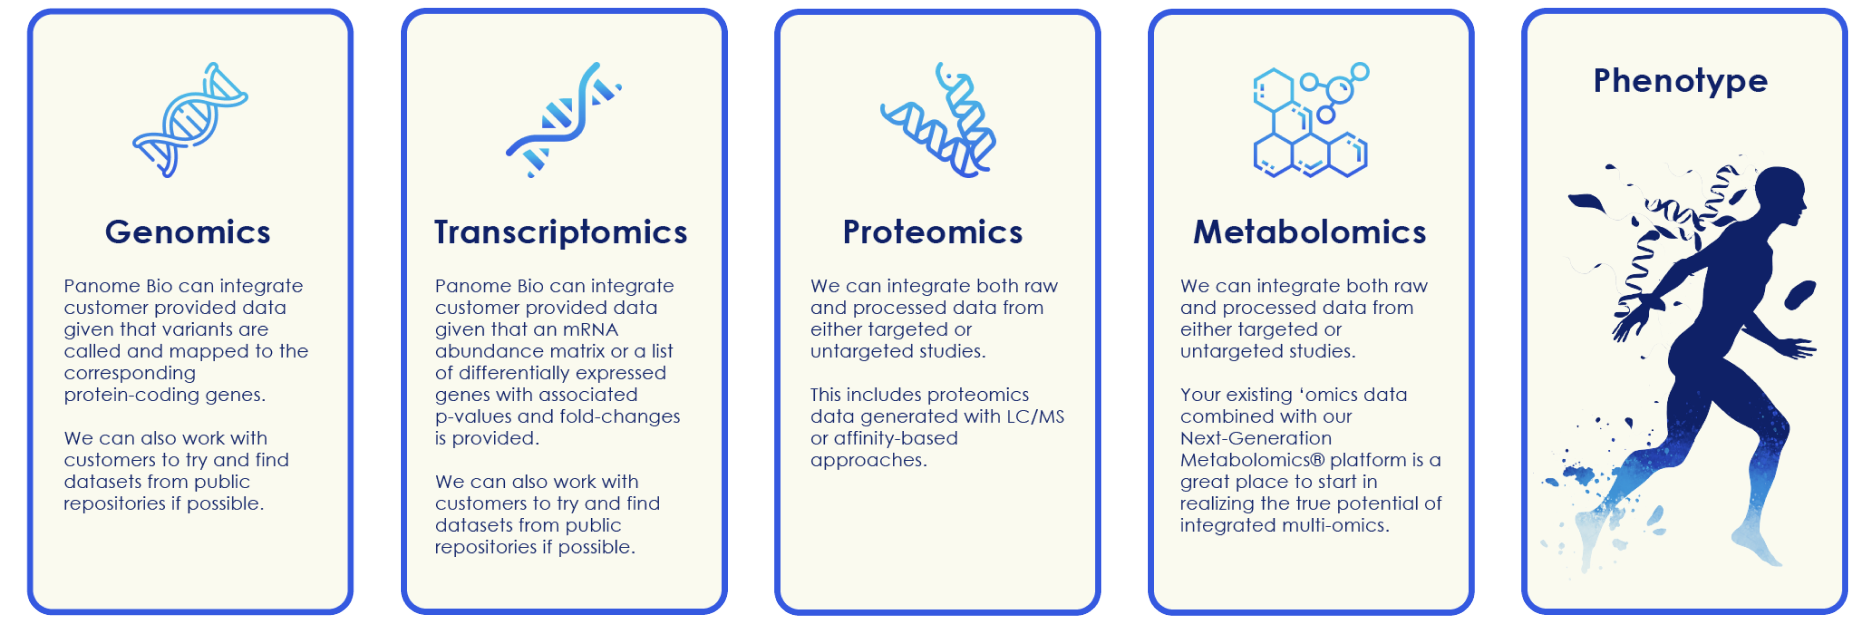
Panome Bio offers true multi-omics analysis – our proprietary approach and unmatched expertise allows us to integrate multiple ‘omics datasets onto shared biochemical networks to deepen pathway coverage and improve mechanistic understanding. This approach, only offered by Panome Bio, provides additional insights and confidence in datasets by showing where protein and metabolite changes coalesce. Panome Bio has assembled a proprietary database of gene, transcript, protein, and metabolite interactions to leverage. This database was built using Panome Bio’s extensive collection of internal data supplemented with connections seen in the scientific literature and publicly-available datasets generated by others. To uncover novel interactions measured in a multi-omic experiment, we also perform data-driven network analyses to determine analytes with concordant changes within a dataset.
Innovative Multi-Omics Technology
for Unparalleled Insights
MassID™ – The Identification Engine Behind Next-Generation Metabolomics®
Untargeted does not mean uncertain. MassID™ is Panome Bio’s proprietary engine that converts complex LC/MS data into confidently scored metabolite identifications.
By combining advanced machine learning, robust noise filtering and probability-based scoring, it detects thousands of metabolites across diverse chemical classes while assigning quantitative confidence to every result. No discovery left behind.
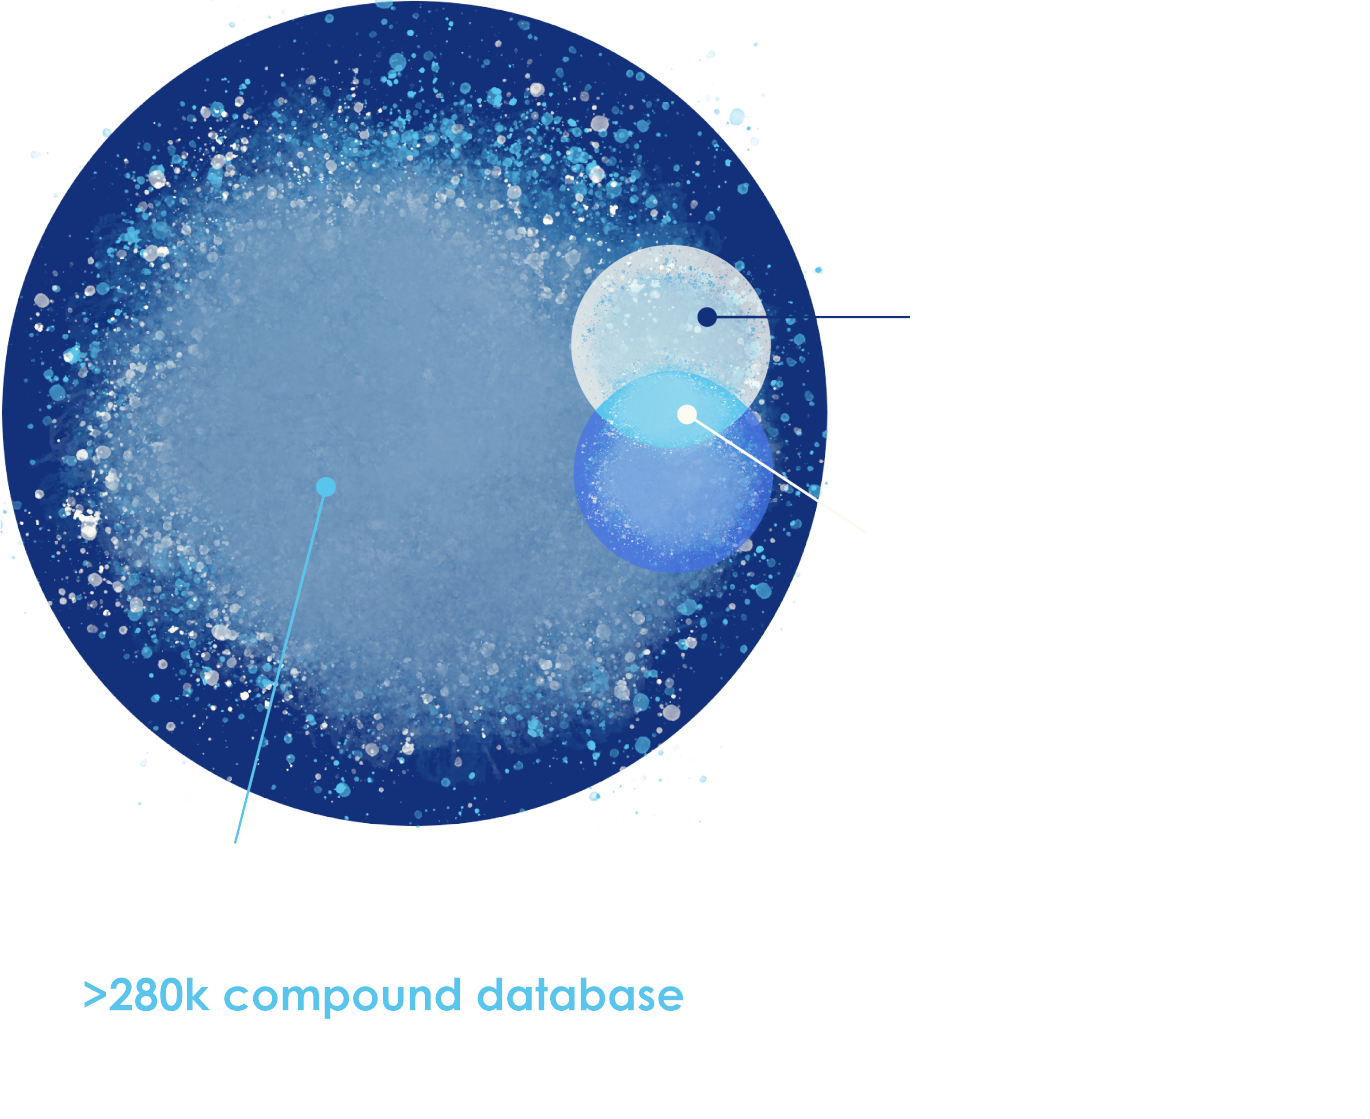
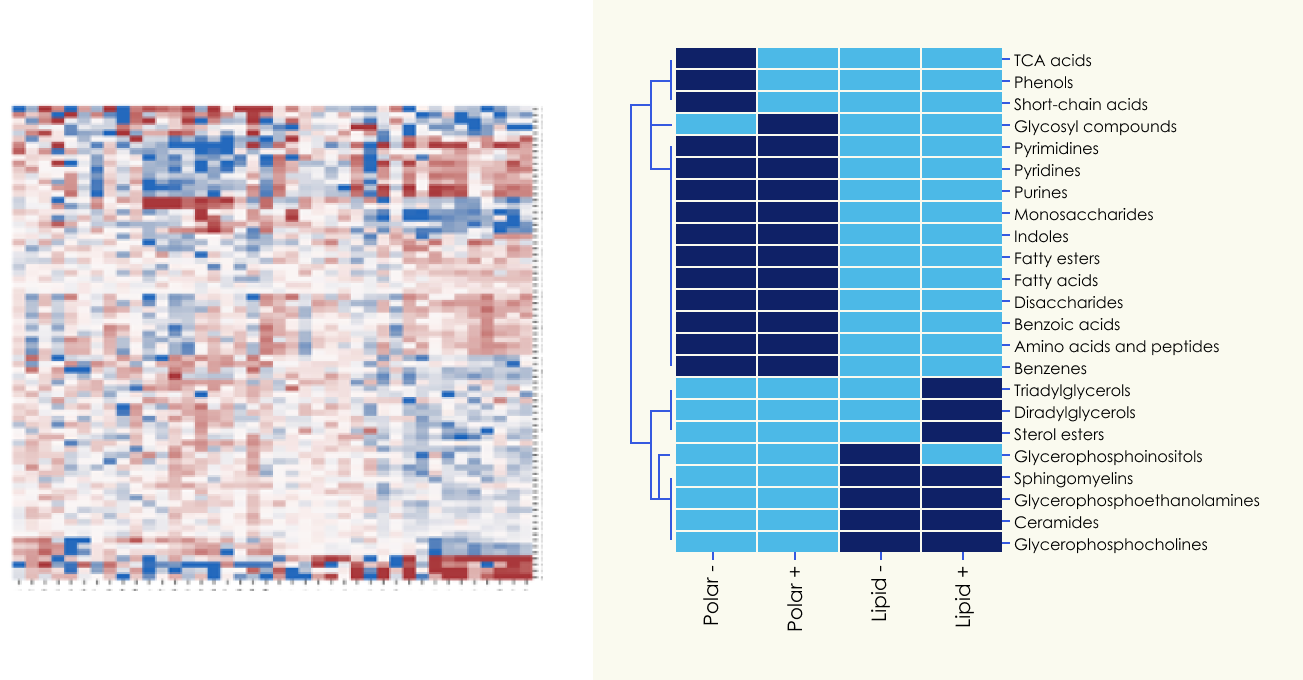
At its core, MassID integrates accurate mass, fragmentation patterns, and chromatographic behavior with a reference database of over 280,000 compounds, enabling FDR-controlled, reproducible metabolomics at scale. The outcome is comprehensive metabolome coverage, expanded chemical detection and clear, confidence-backed biological interpretation.
Innovative Multi-Omics Technology
for Unparalleled Insights
Panome Proteomics Suite
Panome Bio leverages an LC/MS proteomics platform that offers an unbiased, comprehensive view of the proteome across all species and sample types. In addition to broad coverage, our approach can detect sequence variants and post-translational modifications missed by affinity-based platforms. For biofluid proteomics we leverage the Seer Proteograph™ XT coupled with the Thermo Fisher Orbitrap Astral mass spectrometer to see 7.7x coverage compared to competing approaches. For cells and tissues we leverage a label-free, bottom-up untargeted approach well suited for all experimental conditions. As projects move from discovery to validation and pre-clinical development we offer custom and pre-built targeted panels for absolute quantitation of specific proteins of interest.
Innovative Multi-Omics Technology
for Unparalleled Insights
Data Analysis
Panome Bio has developed the only software that enables an accurate, truly untargeted approach to metabolomics and proteomics. In our metabolomics workflow, metabolite signals are detected, aligned, and quantified in each sample. Proprietary algorithms are used to remove non-biological or redundant information. Experimental data such as natural abundance isotope patterns, retention times, and MS/MS fragmentation data is matched to a comprehensive database of over 280k compounds from sources such as HMDB, RefMet, and LipidMaps. Our proteomics data analysis involves a library-free search based on the reference proteome of the organism to quantify relative peptide abundances. These measurements are then aggregated into a single protein abundance measurement. After identifying the metabolites and proteins, an in-depth statistical analysis of the levels is performed according to the needs of the project. This commonly includes unsupervised analyses (e.g., PCA, HCA), supervised analysis (ANOVA, PLS-DA, SVMs, other machine learning analyses), and pathway analysis.
Let’s get started!
Discover the unparalleled advantages of Panome Bio’s advanced multi-omics technology. Our state-of-the-art liquid chromatography-mass spectrometry assays and comprehensive data analysis provide you with the highest quality, most interpretable insights into your metabolomics and proteomics data.
Ready to elevate your research? Connect with us today.