Researchers run experiments, send samples, and receive results that appear complete. However, a significant portion of the metabolome may never be captured in the final dataset.
Not due to sample quality or preparation, but because many metabolomics platforms are inherently limited in what they can detect and identify.
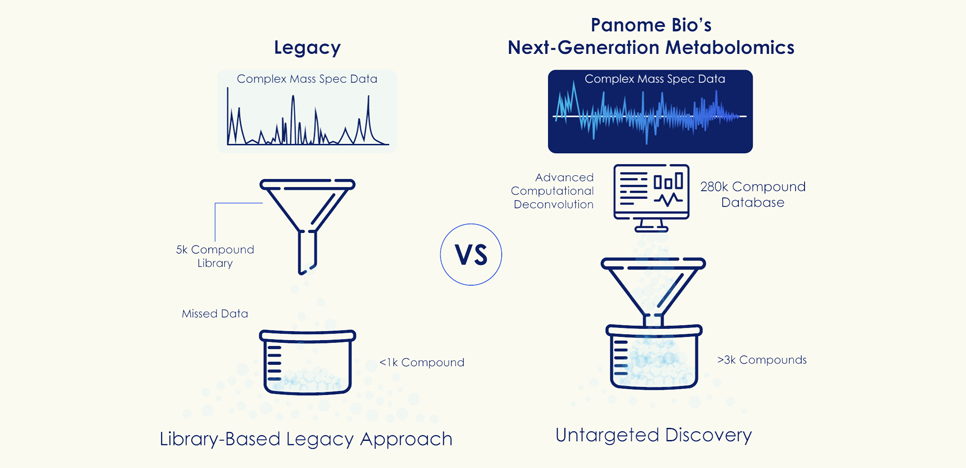
The List Problem in “Untargeted” Metabolomics
Most “untargeted” metabolomics platforms rely on reference libraries, typically containing 5,000, maybe 10,000 compounds, if you’re lucky. Detected signals are matched against this library to assign identities.
Signals that do not match are often excluded from downstream analysis or remain unannotated.
While these approaches are described as untargeted, their identification capabilities are fundamentally constrained by predefined reference sets.
Biological systems are not constrained to predefined reference libraries. A single human plasma sample contains thousands of metabolites. Microbial communities produce exotic compounds that don’t exist in standard libraries. Plant stress responses generate entirely novel chemical signals. Drug metabolism creates unexpected derivatives.
Putting Metabolomics Platforms Head-to-Head
Panome Bio conducted a controlled head-to-head comparison using 50 identical human plasma samples.
Samples were split and analyzed independently:
- A leading legacy metabolomics provider using a library-based workflow
- Panome Bio using Next-Generation Metabolomics®
Same samples. Different analytical philosophies.
The legacy platform identified an average of 777 compounds per sample.
Panome Bio identified an average of 3,003 compounds per sample.
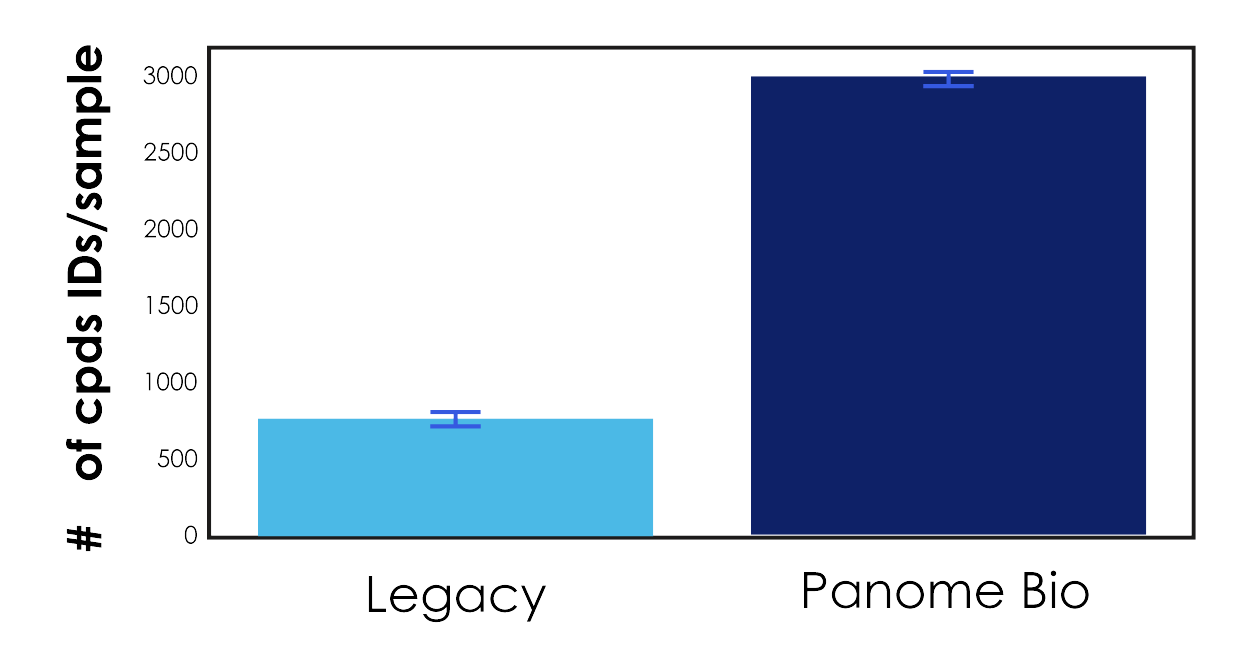
Figure 1: Columns represent the average number of compounds identified per sample by the legacy platform and Panome Bio’s untargeted metabolomics approach.
This is not a modest improvement. This represents nearly a 4x increase in detected compounds from the same biological material.
Approximately 80% of the metabolites detected by Panome Bio were not reported by the legacy platform.
What Lives in the Missing 80%?
The compounds not detected by the legacy platform included
Here’s what the conventional legacy platform missed:
- Lipids: molecules critical to membrane function, signaling, inflammation
- xenobiotics: drug metabolites, environmental exposures, microbiome products
- peptides: signaling molecules, bioactive fragments
- nucleotides: DNA/RNA metabolism, energy transfer
amino acid derivatives: markers of protein metabolism, neurotransmission
This gap expanded further at the pathway level:
- Legacy platform detected 71 pathways (7 unique)
- Panome Bio detected 127 pathways (63 unique)
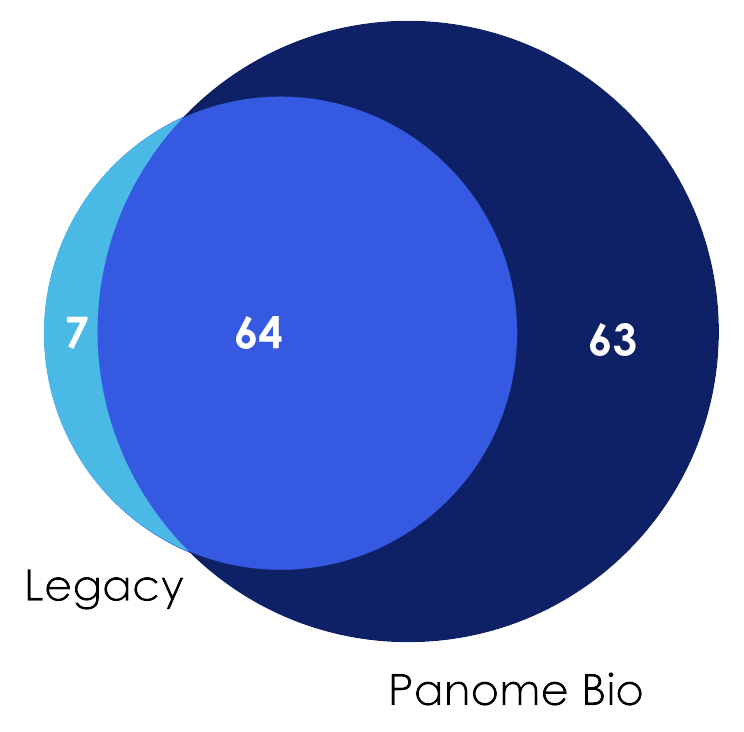
Figure 2: Venn Diagram showing metabolic pathway coverage across both metabolomics platforms.
Why This Matters for Research
The implications extend across disciplines:
Drug development:
Missing metabolites may include off-target products, toxicity signals, or markers that differentiate responders from non-responders.
Microbiome research:
Key small molecules involved in host–microbe interactions often remain undetected, limiting mechanistic insight.
Agriculture and environmental science:
Stress responses, defense compounds and adaptive signaling frequently fall outside standard libraries.
Biomarker discovery:
Limited metabolome coverage reduces the likelihood of identifying robust, reproducible biomarkers.
How Panome Bio Differentiates Itself
Next-Generation Metabolomics uses a two-step approach:
Detect first. Identify second.
- 285,000-compound reference database
- Multiple complementary LC/MS methods per sample
- Orthogonal identification (accurate mass, retention time, isotope patterns, MS/MS)
- Advanced machine learning, robust noise filtering and probability-based scoring
- Curated outputs with biological interpretation
The result is broader metabolome coverage and higher-confidence data.
The Discovery That’s Still Waiting
Many metabolomics studies produce results that appear complete but may be fundamentally limited.
Incomplete pathway coverage, inconclusive biomarker discovery, and weak statistical signals are often attributed to biological variability.
However, the limitation may lie in the analytical platform.
Panome Bio enables researchers to access a more complete view of the metabolome.
Because missing 80% of detectable compounds is not a marginal loss, it fundamentally changes the conclusions you can draw from your data.