
Terms like “comprehensive coverage” and “untargeted detection” are widely used in metabolomics, but they are rarely evaluated in controlled comparisons.
Panome Bio conducted a head-to-head study against a widely used legacy platform using identical samples, independent workflows and quantitative metrics.
The results highlight substantial differences in coverage, reproducibility and data completeness.
The Setup
Fifty identical human plasma samples were split into two groups:
- Legacy metabolomics platform (library-based workflow)
- Panome Bio’s Next-Generation Metabolomics®
Each provider followed its standard protocol. No optimization or special preparation was applied.
The objective was straightforward: from identical samples, how many metabolites can each platform detect and quantify?
Compound detection and Overlap
Legacy platform: 777 compounds per sample (average)
Panome Bio: 3,003 compounds per sample (average)
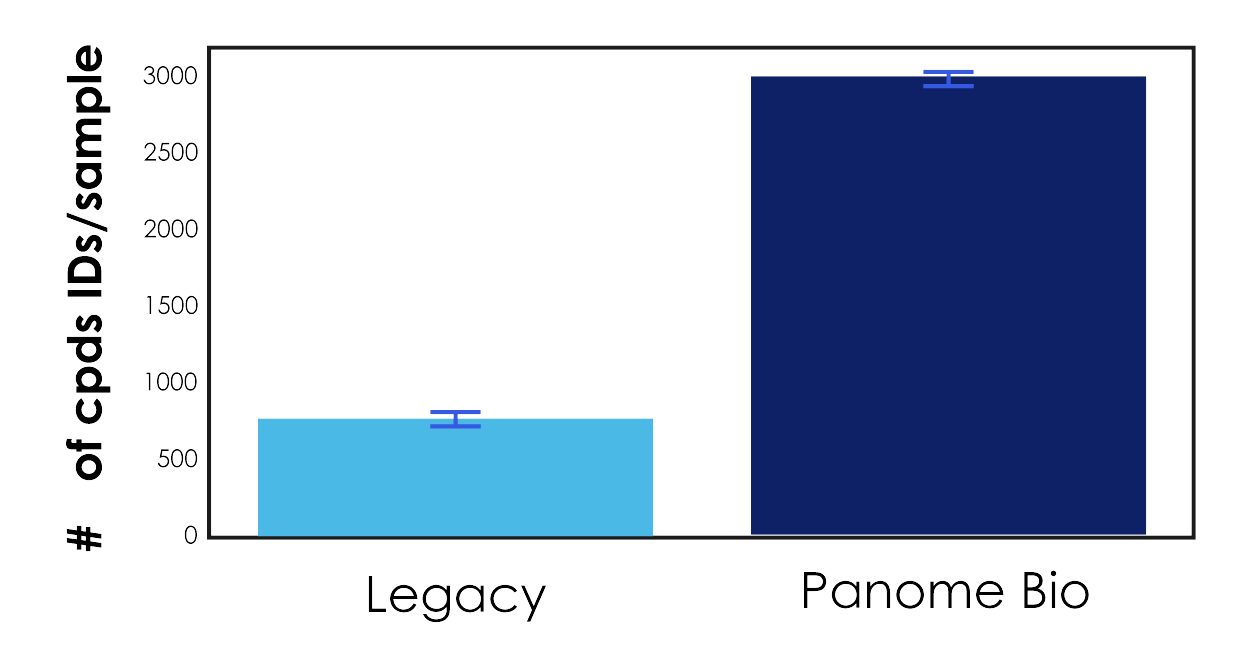
Figure 1: Number of compounds identified per sample
This represents a nearly 4× increase in detected compounds.
Overlap analysis showed that approximately 80% of the compounds detected by Panome Bio were not reported by the legacy platform.
How does detecting more metabolites improve pathway analysis?
Metabolic pathways are reconstructed from detected compounds. When a larger portion of the metabolome is captured, more pathways can be identified and analyzed, leading to a more complete and biologically accurate interpretation of the data.
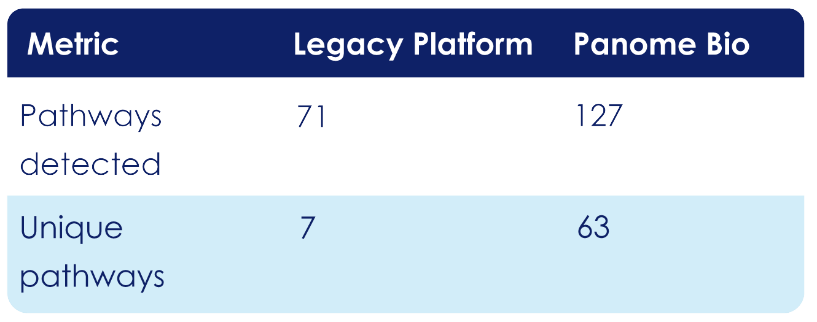
Pathway Coverage
Metabolic pathways provide functional context beyond individual compounds.
Table 1: Detected Pathways. Panome Bio identifies nearly twice as many pathways as the Legacy Platform.
Precision and Reproducibility
Coverage alone is not sufficient. Reproducibility determines statistical confidence.
For compounds detected by both platforms the coefficient of variation (CV) was determined. Lower CV values indicate higher analytical precision:
Legacy platform: 10% median CV
Panome Bio: 4.3% median CV
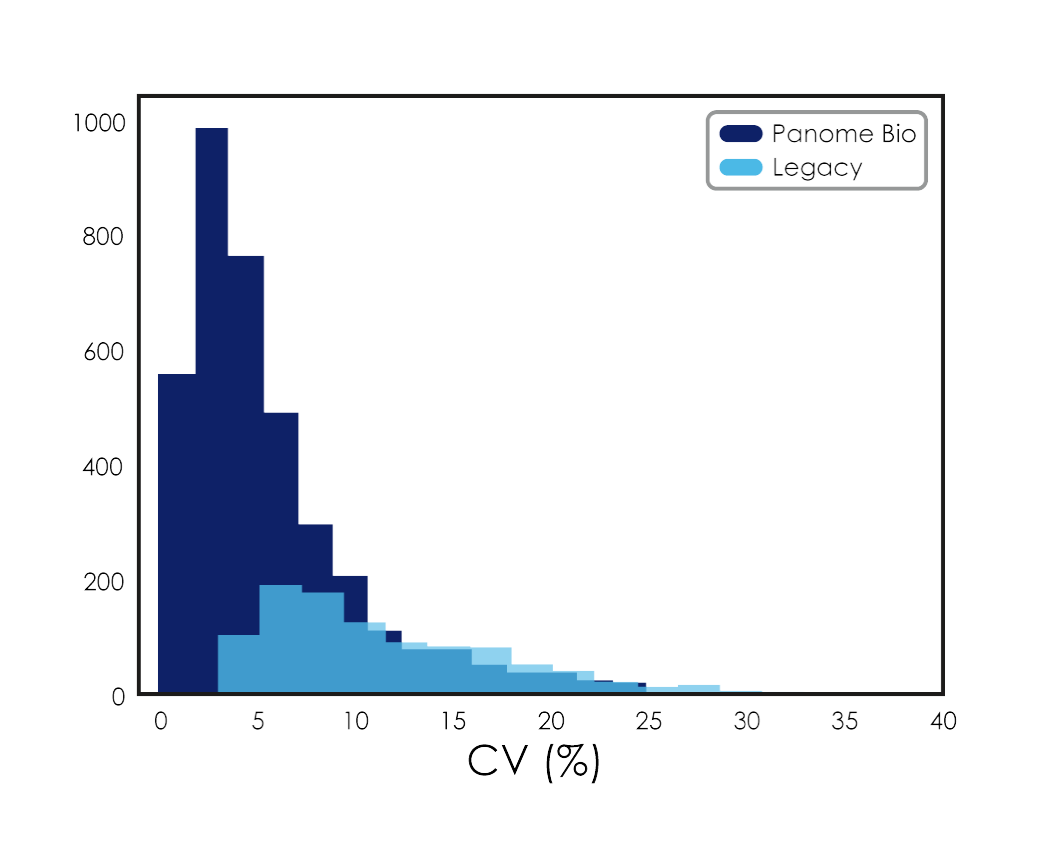
Figure 2: Histogram displays number of identified compounds across CV for Panome Bio and Legacy Platform.
This represents 2.4× improved reproducible, directly impacting statistical power and study design.
How does higher reproducibility improve metabolomics studies?
Lower technical variability (CV) increases statistical power and confidence in results. This allows researchers to detect smaller biological differences with fewer samples, improving study efficiency, reducing cost, and strengthening the reliability of conclusions.
Sample Size Section
Improved reproducibility reduces the number of samples required to detect biological differences:
Table 2: Reduced sample requirements with Panome Bio
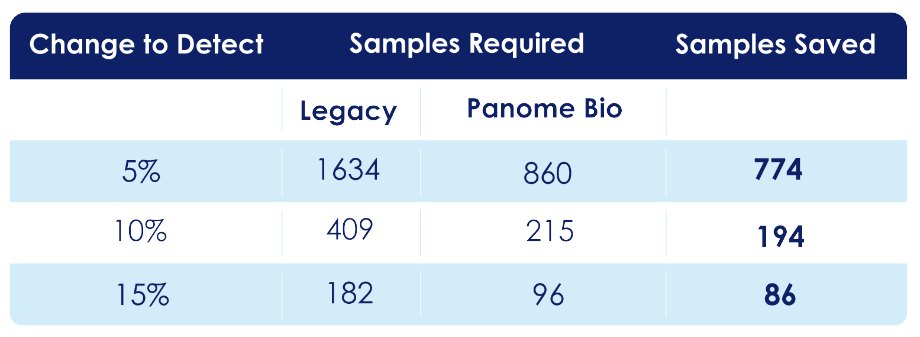
For example, detecting a 5% change requires:
- 1,634 samples (legacy platform)
- 860 samples (Panome Bio)
This reduction can significantly affect study feasibility, cost, and timelines.
Data Completeness
Missing values reduces statistical robustness and complicates downstream analysis.
After standard QC:
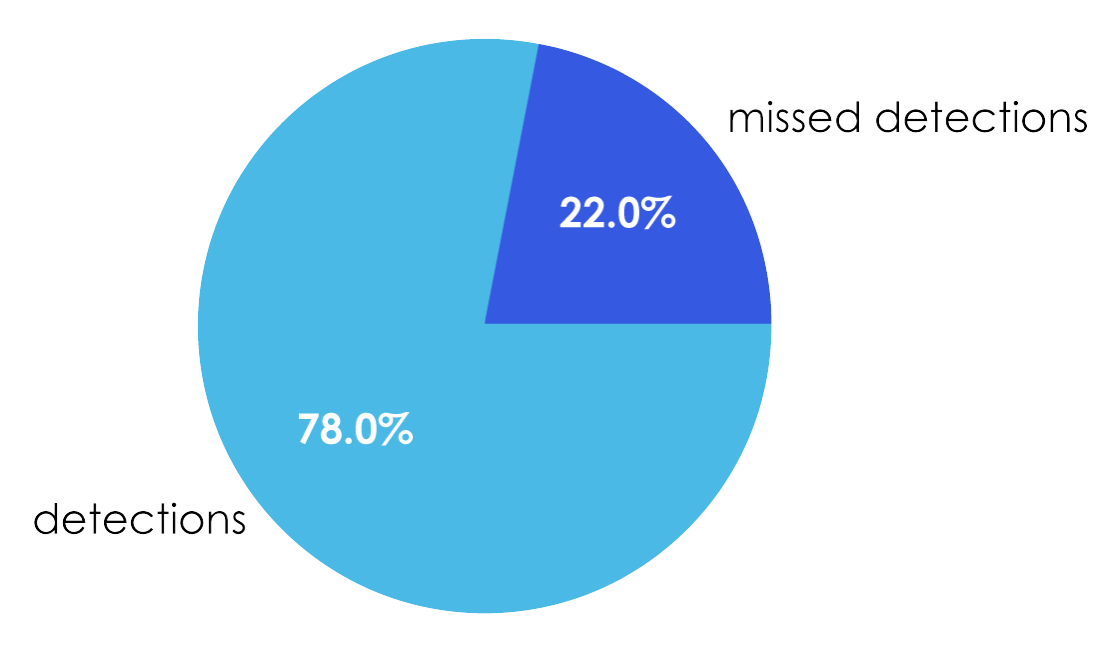
Figure 3: Pie Chart displays data completeness (detection) and missed detection for Legacy Platform.
- Legacy platform: ~22% missing values
- Panome Bio: 0% missing values
Panome Bio produces complete data matrices, eliminating the need for imputation and improving confidence in statistical outcomes.
How much metabolomics research is based on incomplete datasets?
These findings raise this important but uncomfortable question.
Limitations in detection may influence conclusions, particularly in studies reporting minimal differences, modest biomarkers or well-characterized pathways.
In some cases, the absence of signals may reflect analytical limitations rather than biological reality.
The Evolving Standard in Metabolomics
Library-based metabolomics has played an important role in advancing the field. However, its limitations are increasingly evident in direct comparisons.
Next-Generation Metabolomics enables broader compound detection, improved reproducibility and more complete datasets.
This study provides a quantitative benchmark for evaluating metabolomics platforms using controlled, head-to-head data.
Panome Bio collaborates with researchers across drug development, microbiome science, clinical research, agriculture and systems biology to apply these capabilities in real-world studies.